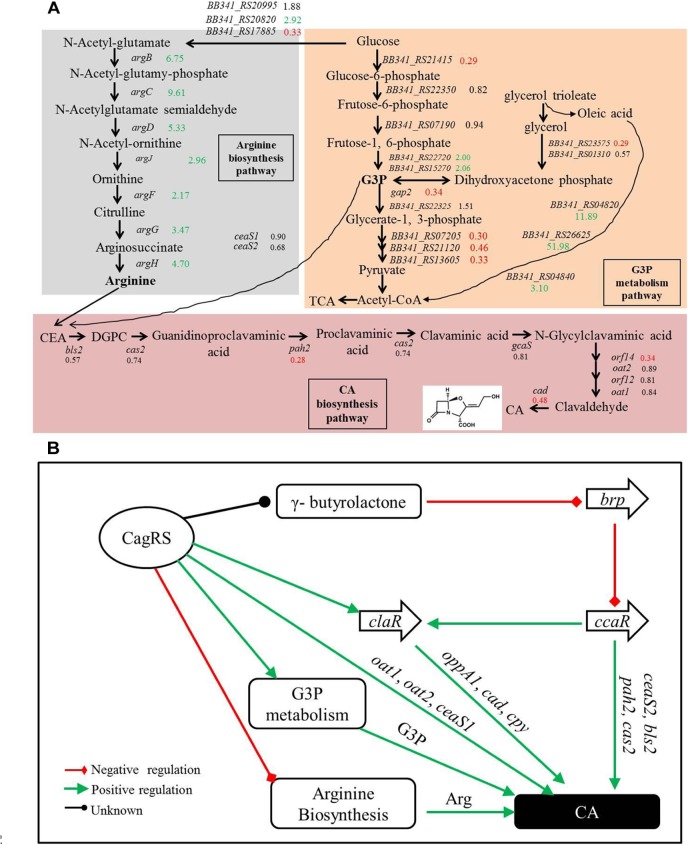
FIGURE 8.
Clavulanic acid biosynthesis is regulated by the TCS CagRS. (A) Schematic overview of the expression profiles of genes involved in CA, G3P and the arginine metabolism pathway. CEA, N2-(2-carboxyethyl)-arginine; DGPC, deoxyguanidino-proclavaminic acid; TCA, tricarboxylic acid cycle. The numbers are the ratios of the comparative expression levels in ΔcagRS compared with the control F613-1, and the data are from the transcriptome and the RT-qPCR assays. Red indicates downregulation, green indicates upregulation, and black indicates no notable change. (B) Model of the TCS CagRS regulatory network of CA biosynthesis.

