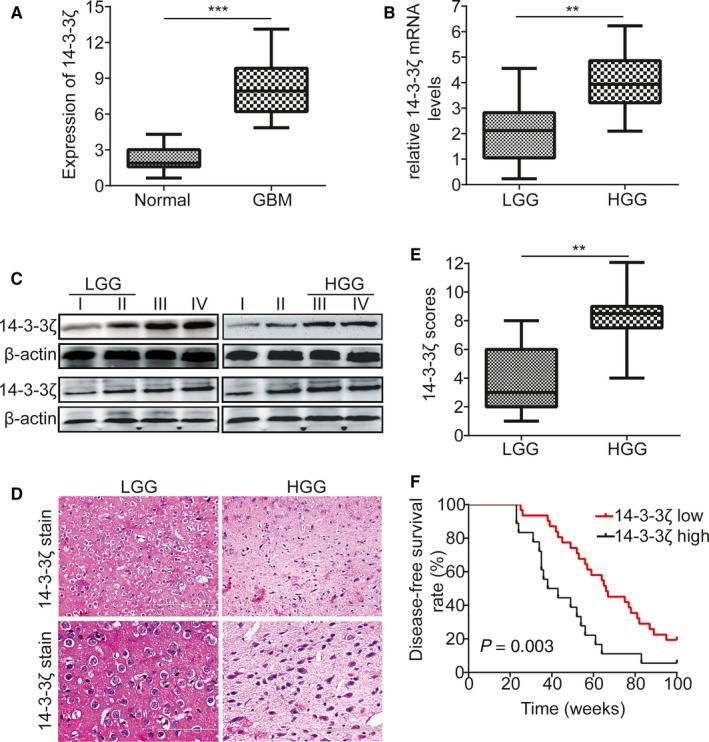
Figure 1.

14‐3‐3ζ is often overexpressed in human gliomas. A, The expression of 14‐3‐3ζ in TCGA glioblastoma databases. B, Relative expression levels of 14‐3‐3ζ detected by RT‐PCR in 49 pairs of gliomas specimens. C, Western blot test of 14‐3‐3ζ expression in total frozen samples lysates deriving from 16 different grades of human gliomas specimens. D, Representative immunohistochemical staining of 14‐3‐3ζ expression in different grades of human gliomas specimens. Bars: 200/100 μm. (original magnification, 100× and 200×). E, 14‐3‐3ζ expression scores are depicted as dot blots. Different grades of gliomas specimens were compared using paired Student's t test. n = 49. F, Kaplan‐Meier analysis demonstrating the relevance between poorer disease‐free survival rates and the decrease in 14‐3‐3ζ expression of gliomas patients. *P < 0.05, **P < 0.01, ***P < 0.001
