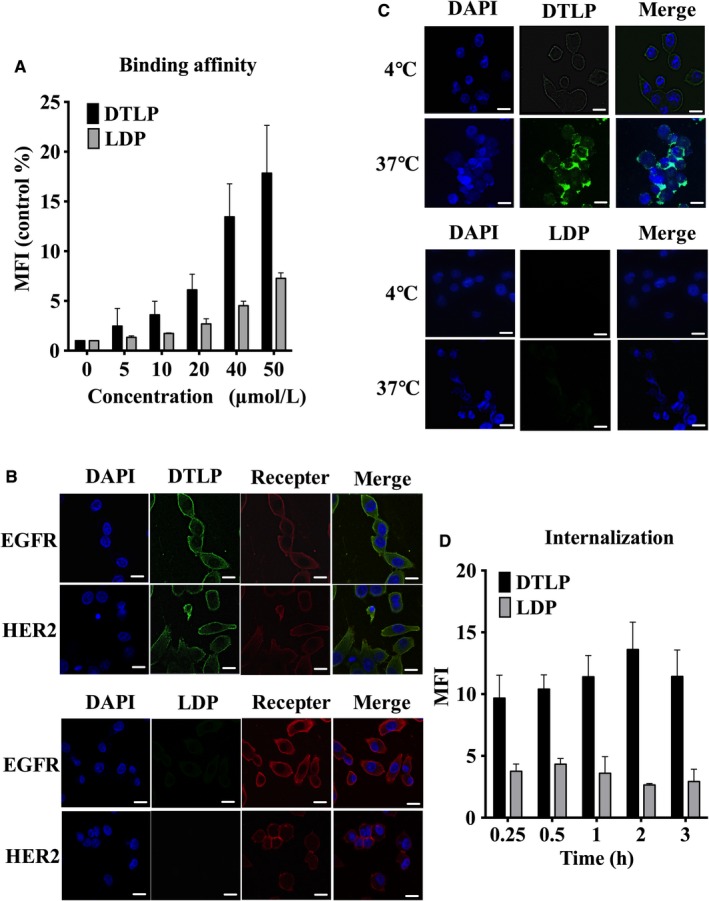
Figure 3.

DTLP effectively internalized into MIA‐paca‐2 cells after bispecific binding to EGFR and HER‐2. A, MIA‐paca‐2 cells were incubated with FITC‐labeled DTLP protein and LDP protein at indicated concentrations, and the mean fluorescence intensities (MFIs) were analyzed by flow cytometry. Following FACS, MFI/Control were plotted vs protein concentrations representing three repeated times analyzed with GraphPad Prism 6.0 software. B, Colocalization of DTLP with EGFR (Right) and HER‐2 (Left) on MIA‐paca‐2 cells analyzed by laser scanning confocal microscopy (400×). Immobilized cells were incubated with anti‐EGFR or HER‐2 antibody (1:500 in dilution) as well as 1 μmol/L of FITC‐labeled DTLP/or LDP at 4℃ for 1 h, respectively, followed with fluorescently labeled secondary antibody (1:200 in dilution) added in order. DAPI is shown in blue for nuclei with DTLP/or LDP in green and EGFR and HER‐2 in red, followed by merged images (MERGE) obtained by superimposing DAPI, anti‐EGFR/or HER2 mAbs, and DTLP/LDP. C, Internalization of DTLP in MIA‐paca‐2 cells was detected by laser scanning confocal microscopy (400×). Living cells with 10 μmol/L of FITC‐labeled DTLP/or LDP were incubated for 1 h at 4 and 37°C successively to allow the proteins into cells. Blue indicates nuclei stained with DAPI, while green represents DTLP/or LDP labeled with FITC. MERGE indicates superimposed DAPI and DTLP/LDP. D, Internalization of FITC‐labeled DTLP/LDP in MIA‐paca‐2 cells at various times detected by flow cytometry. After incubation with FITC‐labeled proteins at 4°C for 1 h, cells were resuspended at 37°C and collected to measure their fluorescence intensity at various times. Following FACS, MFI/Control was plotted vs times after three repeated experiments. For all graphs, error bars indicate SD for n = 3. SD values were calculated with GraphPad Prism 6.0 software. Scale bars indicate 20 μm
