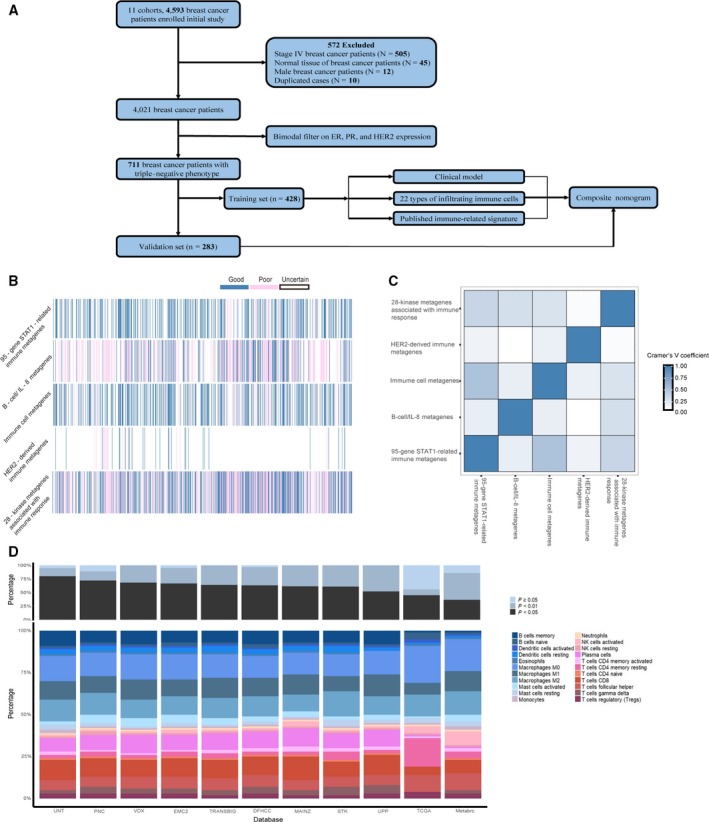
Figure 1.

Immune‐related genomic landscape of TNBC based on gene expression profiling. A, Flowchart of the study design. B, Concordance of signature‐based prediction results. Each column represents the prediction of each individual sample. The blue, pink, and white bars indicate presence (good), absence (poor), and uncertain (uncertainty) prognoses of the corresponding signature, respectively. C, Heatmap of Cramer V coefficients showing correlation between these immune‐related genomic signatures. D, Bar charts summarizing immune cell subset proportions and CIBERSORT P‐value by study
