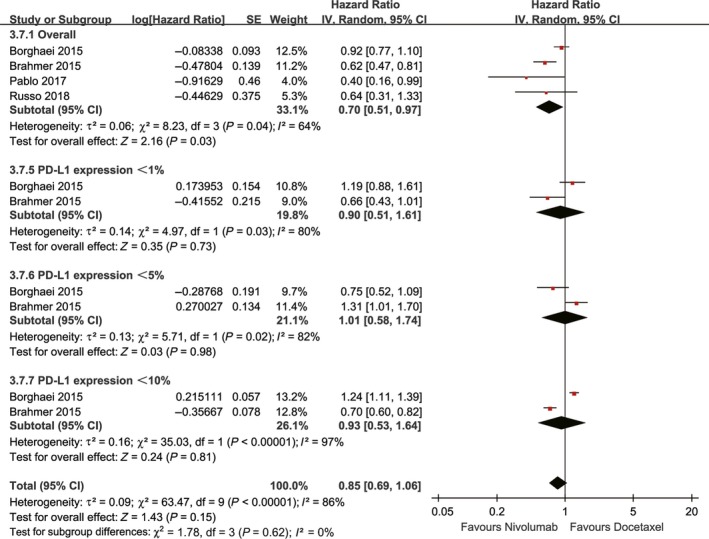
Figure 3.

Forest plots of HR of OS associated with nivolumab vs docetaxel (including subgroup analysis according to PD‐L1 expression)

Forest plots of HR of OS associated with nivolumab vs docetaxel (including subgroup analysis according to PD‐L1 expression)