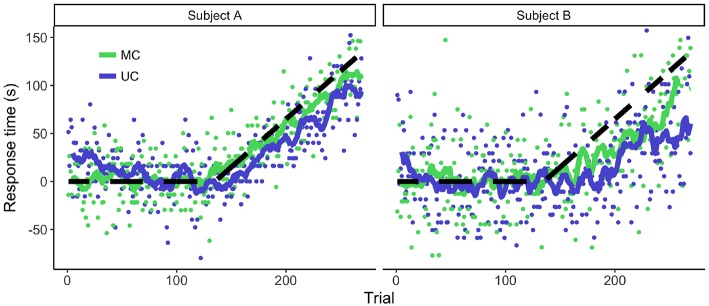
Figure 2.
Adaptive behavior of two representative participants during the temporal perturbation experiment. Dots denote the individual responses per trial and the lines are the moving averages. Positive values denote an early response. The dashed line represents the temporal perturbation. The more the responses followed this line, the more successful the adaptation to the temporal perturbation.

