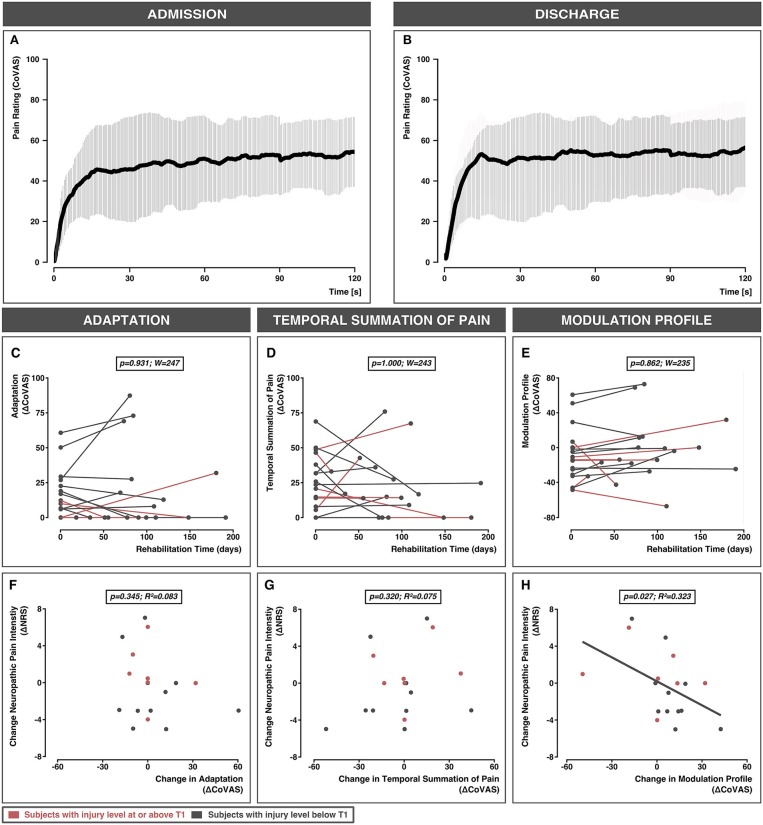
Figure 2.
Averaged pain ratings over the 120 s testing period are shown for all 18 subjects with complete data at admission (A) and discharge (B). The gray bars represent standard deviations. The effect of time on adaptation (C), temporal summation of pain (D), and modulation profile (E) are shown for individual rehabilitation times. Bottom panel: The relationship between the change in neuropathic pain intensity and change in adaptation (F), change in temporal summation of pain (G), and change in modulation profile (H). Subjects with injury levels at or above T1 are colored in red. Subjects with injury levels below T1 are colored in gray. CoVAS, continuous visual analog scale; NRS, numeric rating scale.

