FIGURE 5.

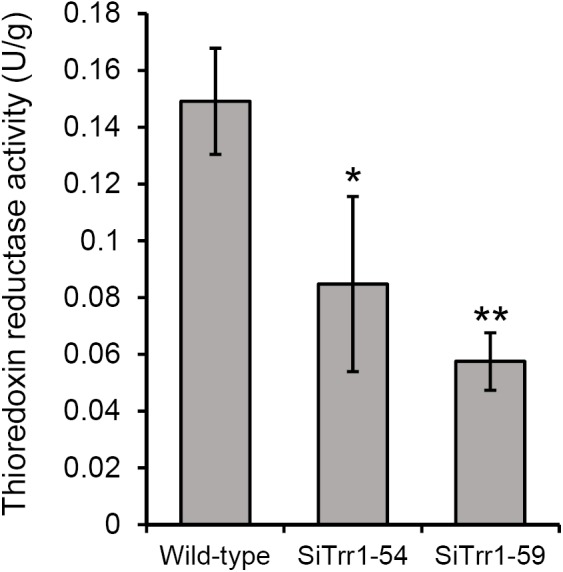
Total TrxR activity quantified in the extracts of 3-day-old PDA cultures of SsTrr1 gene-silenced strains. Bars indicate standard deviation. Asterisks denote significant differences (one-way ANOVA). ∗P < 0.05; ∗∗P < 0.01.

Total TrxR activity quantified in the extracts of 3-day-old PDA cultures of SsTrr1 gene-silenced strains. Bars indicate standard deviation. Asterisks denote significant differences (one-way ANOVA). ∗P < 0.05; ∗∗P < 0.01.