FIGURE 8.
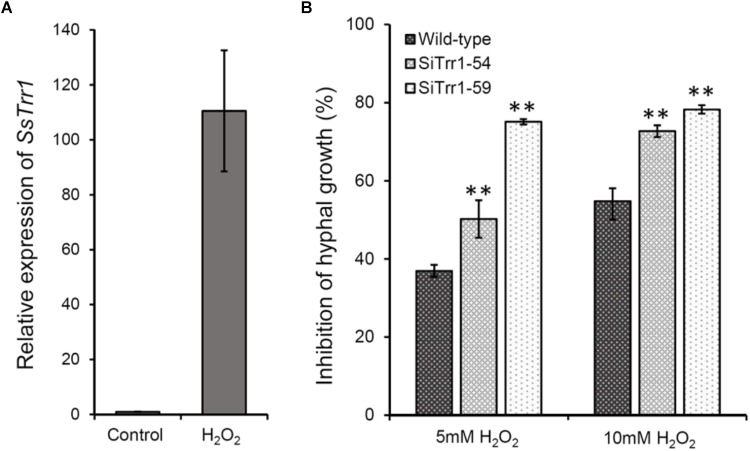
Functional analysis of SsTrr1 in oxidative stress response. (A) SsTrr1 transcript in hyphae treated with 10 mM H2O2. Total SsSvf1 cDNA abundance in the samples was normalized to using tub1 gene as a control. The relative expression of SsTrr1 in the untreated strain was set as 1. Bars indicate standard error. (B) Percent growth inhibition of wild-type strain and SsTrr1 gene-silenced strains on PDA medium with 5 and 10 mM H2O2. Bars indicate standard deviation. Asterisks denote significant differences (one-way ANOVA). ∗∗P < 0.01.

