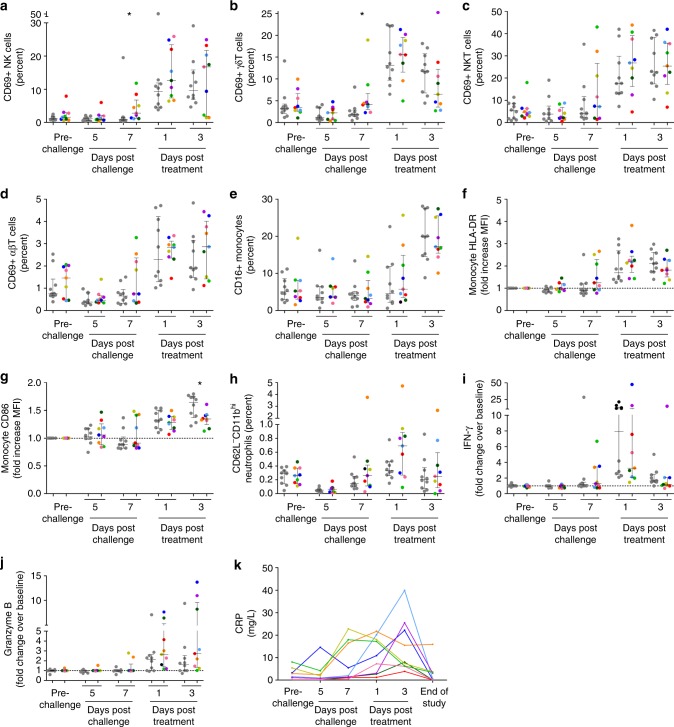
Fig. 2.
In vivo activation of lymphocytes, monocytes and neutrophils after CHMI. In vivo leucocyte activation was determined by direct staining of fresh whole blood with fluorescent antibodies every 2 days post-challenge. Lymphocytes were defined based on forward scatter and sideward scatter characteristics, and duplet events were excluded. a NK cell activation was defined as the percentage of CD3-CD56dimCD16+ live cells expressing CD69. b γδT cell activation was defined as the percentage of CD3+γδTCR+ live cells expressing CD69. c NKT cell activation was defined as the percentage of CD3+γδTCR-CD56+ live cells expressing CD69. d αβT cell activation was defined the as percentage of CD3+γδTCR-CD56− live cells expressing CD69. e Monocytes were defined based on forward and side scatter characteristics, and the as HLA-DR+CD14+. Within the monocyte population, cells were then divided into CD16- and CD16+ monocytes. f–g Within the CD16- monocyte population, the relative change in mean fluorescent intensity of HLA-DR and CD86 compared to pre-malaria challenge values was determined. h Neutrophils were defined based on forward and side scatter characteristics, and then defined as HLA-DR-CD14-CD16+CD11b+. Activated neutrophils were defined as CD62LdimCD11bhigh. i–j IFN-γ and granzyme B were measured by Luminex assay in citrate plasma taken ever 2 days. Circulating cytokine levels are corrected for baseline levels (pre-BCG vaccination time point) at each time point. In all graphs the grey dots represent non-BCG vaccinated control group volunteers (n = 10), and each coloured dot shows an individual BCG vaccinated volunteer (n = 9). Statistical analysis are between BCG vaccinated and control volunteers at a single time point, and p-values are the results of Mann–Whitney U-test. *p < 0.05. k Circulating CRP levels were measured in citrate plasma are shown for each BCG vaccinated volunteer (colours consistently represent the same volunteers across each graph)

