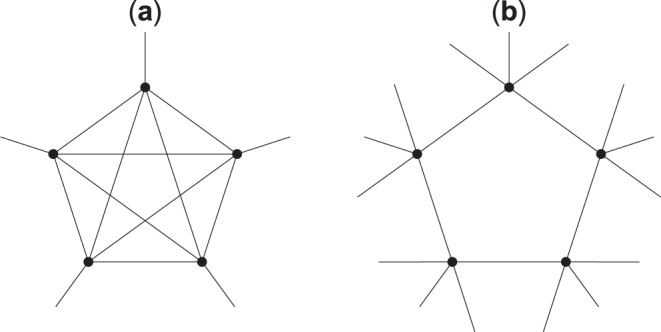
Figure 1.

Illustration for how the clustering coefficient can change even when the degree, i.e., the number of connections, is unchanged. Panel (a) is a stylised representation of a high-fertility society in which five agents are depicted, who are all connected to one another and, in addition, to one further person each. Panel (b) also depicts five agents; these are, however, only connected to two other agents within this circle, and an additional three others outside the circle and not connected to each other. This panel is the stylised representation of a low-fertility and/or urbanised society. Note that the network degree of each agent is five on both panels, i.e., each agent in the circle has five social connections. Yet, the clustering coefficients of all agents, i.e., the number of closed triangles out of all the possible triangles in their individual social network, is 50% in Panel (a) and 0% in Panel (b).
