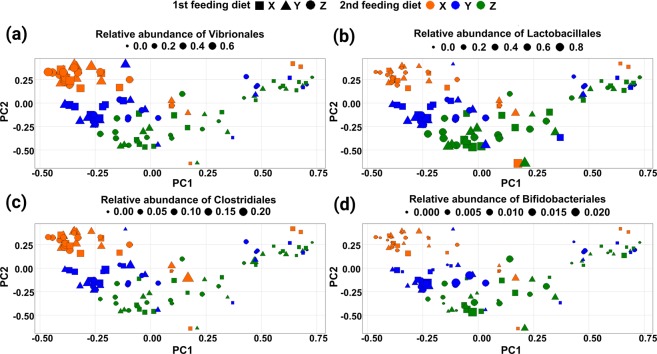
Figure 5.
PCA plots of the intestinal microbiome. The four panels show the bacterial community at the end of the second feeding period, represented by pseudo-variables generated during Principal Component Analysis in relation to the 1st and 2nd Feeding Diets. Each object represents one individual fish. Additionally, the panels (a–d) present the relative abundances of Vibrionales, Lactobacillales, Clostridiales and Bifidobacteriales, respectively, for each fish. The shape of objects represents the 1st Feeding Diet; the colours indicate the 2nd Feeding Diet and the size of each object relates to the relative abundance of the bacterial order that is indicated in the legend of each panel.

