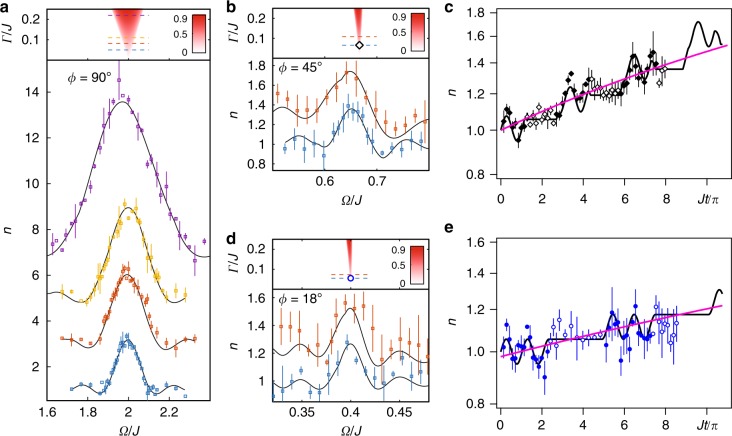
Fig. 2.
Detecting the resonances with time-periodic dissipation. a n(tf, Ω) around the one-photon resonance Ωn = 2J. Purple for Γ/J = 0.22, tf = 1.98 ms; Yellow for Γ/J = 0.11, tf = 3.31 ms; Red for Γ/J = 0.082, tf = 3.97 ms; and Blue for Γ/J = 0.05, tf = 5.29 ms. b n(tf, Ω) around the three-photon resonance Ωn = 2J/3. Red for Γ/J = 0.11, tf = 2.80 ms; Blue for Γ/J = 0.065, tf = 3.79 ms. c n(t) at Ωn = 2J/3 with Γ/J = 0.065 located in (b) by the diamond shape. d n(tf, Ω) around the five-photon resonance Ωn = 2J/5. Red for Γ/J = 0.07, tf = 4.64 ms; Blue for Γ/J = 0.055, tf = 4.74 ms. e n(t) at Ωn = 2J/5 with Γ/J = 0.055 located in (d) by the circle shape. The initial phase ϕ of the square-wave modulation is chosen to anti-synchronize to the RF field with ϕ = π/2, π/4, π/10 for one-, three-, and five-photon resonance respectively. In a, b, and d, all the data and simulation curves have a base line of n = 1, but are vertically shifted for the presentation purpose. The side peaks are due to the finite probe time. In c, e, the data with solid shapes corresponds with the dissipation on, the data with empty shapes are with the dissipation off, and the pink curves are the exponential fitting. For all figures, the solid curves are numerical simulations without free parameter. The error bars represents the standard deviation of the measurements

