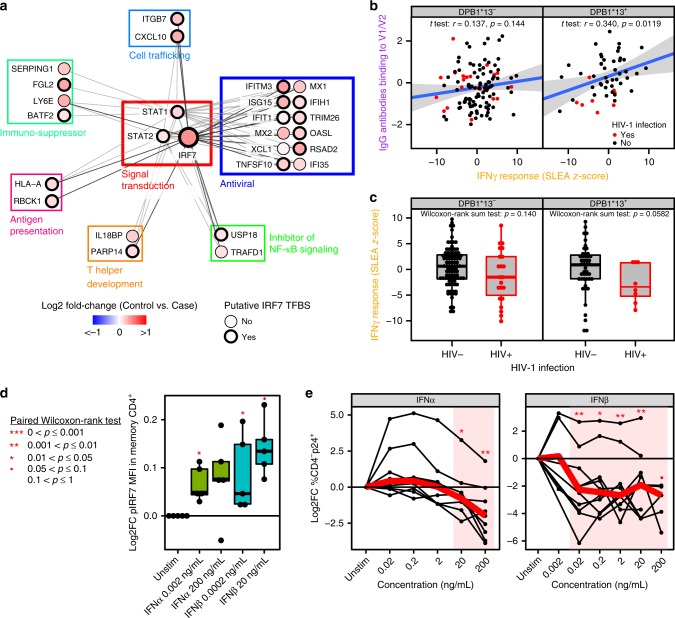
Fig. 5.
Mechanisms associated with a reduced risk of HIV-1 acquisition among RV144 vaccinees. a Network showing the genes implicated in IFNγ signaling with annotated functions. Nodes correspond to genes; the color of a node is proportional to the log2 fold-change between controls and HIV-1 cases. Edges are inferred by GeneMANIA and correspond to physical interactions, colocalization, or co-expression. The remaining genes part of this signature but with unknown/unrelated functions can be found in Supplementary Data 5. b Scatter plot presenting the expression of IFNγ responsive genes as a function of the levels of IgG antibodies binding to V1/V2 and DPB1*13 alleles. The average expression of the IFNγ genes was calculated using the SLEA z-score method. A linear regression model (blue line), and its 95% confidence interval (gray zone), was fit between SLEA z-score and IgG antibodies against V1/V2, and this separately for each DPB1*13 allele. A Pearson correlation and a t test were performed to assess the significance of the correlation between the transcriptomic data and antibody response. c Scatter plot presenting the association of IFNγ target genes and HIV-1 acquisition, separately for patients DPB1*13− and DPB1*13+. Wilcoxon-rank sum test was performed to assess the significance of the association between the transcriptomic data and HIV-1 acquisition. d Boxplot of the ratio of phosphorylated IRF7 in memory CD4+ cells stimulated with interferon compared to unstimulated memory CD4+ cells. The ex vivo experiments were performed on cells from five healthy donors. The fold-change in the median fluorescence intensity (MFI) between interferon stimulated samples and the unstimulated condition is presented as a function of the concentration of interferon α and β used. e Lines plot showing the ratio of the frequency of CD4−p24+ after interferon stimulation over the unstimulated levels as a function of interferon concentration. The red lines indicate the median frequencies of CD4−p24+ across ten healthy donors. d, e A paired Wilcoxon rank-sum test was used to assess the statistical significance of the fold-change (***p ≤ 0.001, **0.001 < p ≤ 0.01, *0.01 < p ≤ 0.05, •0.05 < p ≤ 0.1)

