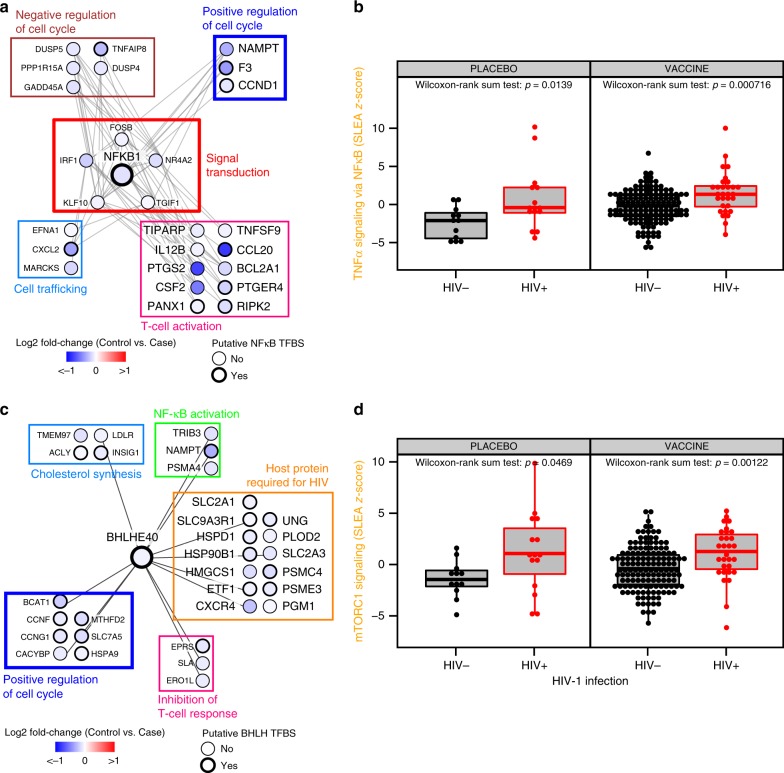
Fig. 6.
Mechanisms associated with increased risk of HIV-1 acquisition. a Network showing the genes implicated in NF-κB signaling. Nodes correspond to genes; the color of a node is proportional to the log2 fold-change between controls and HIV-1 cases. Edges are inferred by GeneMANIA and correspond to physical interactions, colocalization. or co-expression. The remaining genes part of this signature but with unknown/unrelated functions can be found in Supplementary Data 5. b Boxplot presenting the association of genes implicated in NF-κB signaling and HIV-1 acquisition, separately for placebo recipients and vaccinees. Wilcoxon-rank sum test was performed to assess the significance of the association between the transcriptomic data and HIV-1 acquisition. On the boxplot, the lower whisker, the lower hinge, the midhinge, the upper hinge and the upper whisker correspond to the interquartile (IQR) from the first quartile, the first quartile, the median, the third quartile and the IQR from the third quartile, respectively. c Network showing the genes implicated in mTORC1 signaling. Nodes correspond to genes; the color of a node is proportional to the log2 fold-change between controls and HIV-1 cases. Edges are inferred by GeneMANIA and correspond to physical interactions, colocalization, or co-expression. The remaining genes part of this signature but with unknown/unrelated functions can be found in Supplementary Data 5. d Boxplot presenting the association of genes implicated in mTORC1 signaling and HIV-1 acquisition, separately for placebo recipients and vaccinees. Wilcoxon-rank sum test was performed to assess the significance of the association between the transcriptomic data and HIV-1 acquisition

