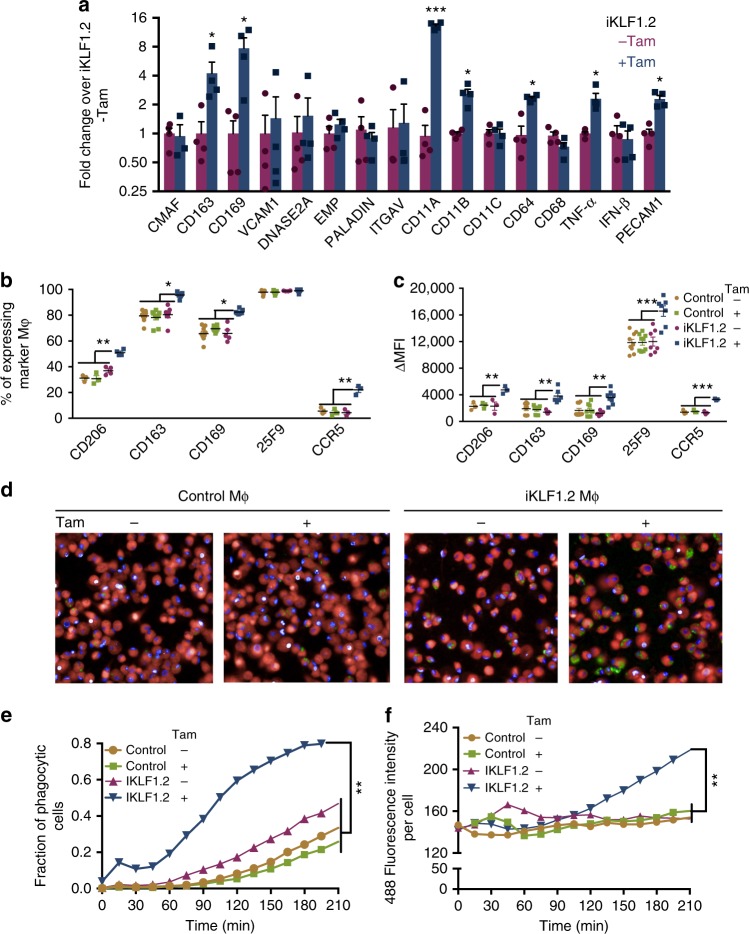
Fig. 2.
Activation of KLF1 in iPSC-DMs alters macrophage phenotype. a Real time PCR analyses of EI macrophage related genes in iPSC-DM from iKLF1.2 iPSCs in the presence and absence of tamoxifen (Tam) (n = 4, non-parametric Wilcoxon test). b Flow cytometry analyses of EI-related cell surface markers expression in control iPSC-DMs (control) and iKLF1.2-DMs (iKLF1.2) in the presence and absence of tamoxifen (n = 4 biologically independent samples, non-parametric Kruskal–Wallis test and Dunn’s post-test). c Mean fluorescence intensity (MFI) of cell surface marker expression in parental iPSC-DMs (control) and iKLF1.2-DMs in presence and absence of tamoxifen (n = 4 biologically independent samples, non-parametric Kruskal–Wallis test and Dunn’s post-test). d Images captured at 175 min after addition of Zymosan-green beads to control iPSC-DMs (Control Mϕ) and iKLF1.2 DMs (iKLF1.2 Mϕ) cells in the presence and absence of tamoxifen (×40). e Phagocytic fraction analyses as measured by the proportion of cells containing green beads from 0 to 210 min in control and iKLF1.2-DMs (−/ +tamoxifen) (n = 5 biologically independent samples, two-way ANOVA and Bonferoni post-test). f Phagocytic index as calculated by level of green fluorescence per phagocytic cell (n = 5 biologically independent samples, two-way ANOVA and Bonferoni post-test). *p < 0.05, **p < 0.01, ***p < 0.001, ****p < 0.0001

