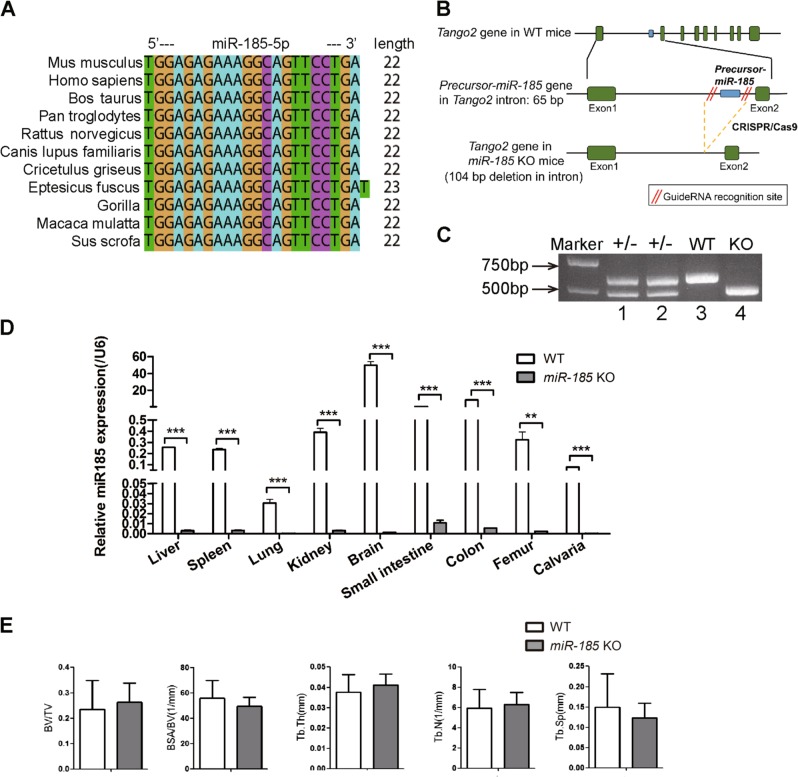
Fig. 1. Generation of mmu-miR-185−/− mice.
a Analysis of miR-185 conservation in different species. b Scheme used to generate miR-185 knockout mice. c Genotyping of transgenic mice by PCR with DNA extracted from mouse tail. Expected band sizes: miR-185 knockout (KO) 512 bp, wild type (WT) 616 bp, heterozygous showed two bands. d Representative real-time PCR result showed endogenous miR-185 expression levels in different tissues of WT and KO mice (n = 3). e Micro-computed tomography (μCT) analysis of 6-week-old WT and KO male mice femur samples (n = 5). Bone volume/total volume (BV/TV), trabecular bone surface/bone volume (BSA/BV), trabecular bone thickness (Tb. Th), trabecular bone number (Tb. N), and trabecular bone space (Tb. Sp). Data were shown as mean ± S.D (**P < 0.01 ***P < 0.001)

