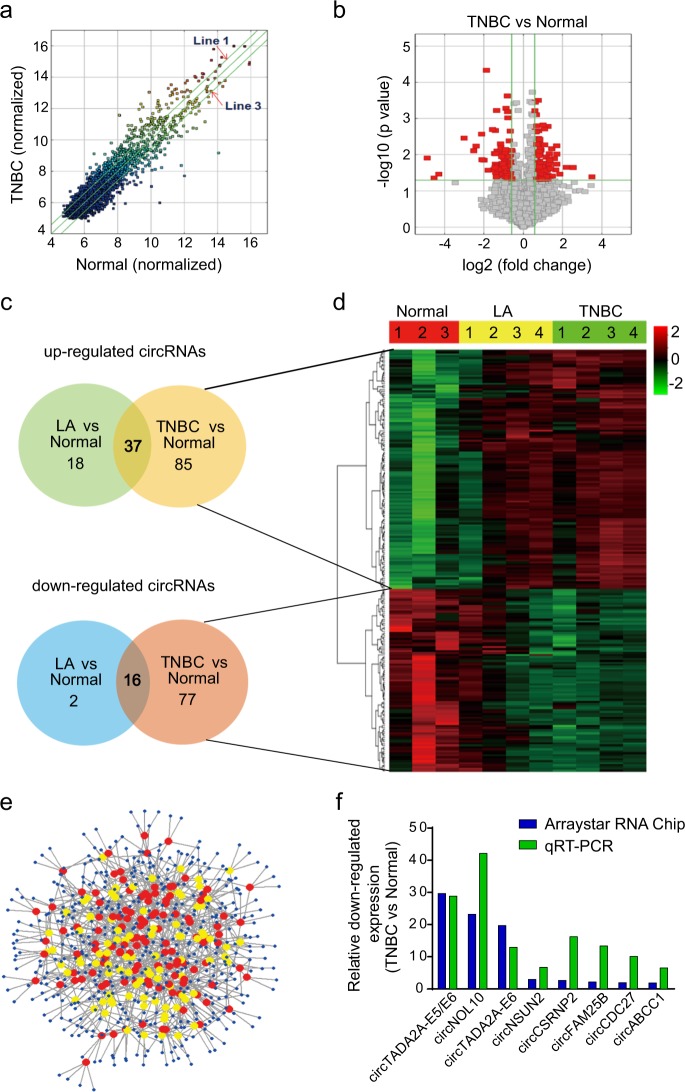
Fig. 1. Profiling of circular RNAs (circRNAs) from breast cancer patients’ specimens.
a Scatter plot. Green lines represent fold-change. Above line 1 and below line 3 indicate >1.5-fold-change in circRNA expression level in TNBC (N = 4) as compared to NMGT (N = 3). b Volcano plot. The vertical green lines correspond to 1.5-fold upregulated and downregulation, and the horizontal green line represents p value of 0.05. The red points in the plot represent circRNAs with statistically significant differential expression. c circRNAs profile for TNBC and LA (N = 4) subtypes as compared to NMGT. d Clustered heatmap for differentially expressed circRNAs. Rows represent circRNAs and columns represent tissue types. circRNAs were classified according to the Pearson correlation. The color scale runs from green (low intensity) to black (medium intensity), to red (strong intensity). e Network of 215 differentially expressed circRNAs and the predicted target miRNAs in TNBC. Nodes are represented in different colors: red for upregulated circRNAs, yellow for downregulated circRNAs, and blue for predicted miRNA sponge circRNAs. f Relative downregulated expression of circRNAs by microarray data and quantitative reverse transcription polymerase reaction (qRT-PCR) in TNBC

