Fig. 4.
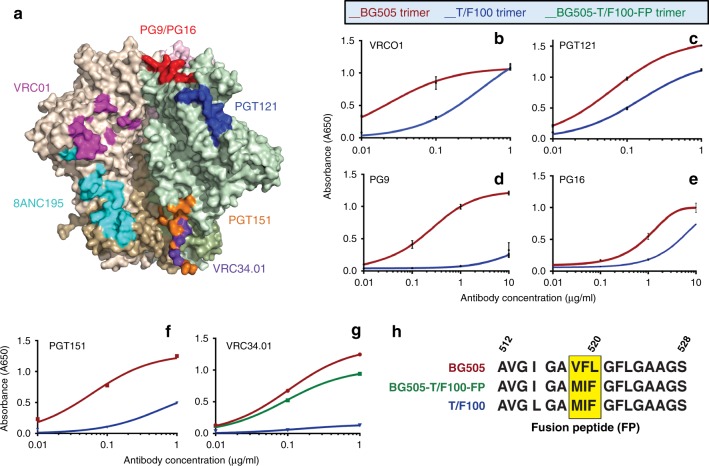
Antigenicity of the T/F100 trimer. a Epitope regions recognized by different bNAbs are shown on a surface-view structural model of BG505 gp140 trimer (PDB: 5I8H). Each protomer of the trimer are shown in different colors: brown, green, or pink. The gp120 and gp41 subunits of each protomer are shown in light and dark shades of the same color, respectively. b–g Binding curves of T/F100 (blue curve) and BG505 (red curve) trimers with bNAbs VRCO1 (b), PGT121 (c), PG9 (d), PG16 (e), PGT151 (f), and VRC34.01 (g), as determined by ELISA. Also shown in (g) is binding of BG505-T/F100-FP trimer to VRC34.01 (green curve). h Alignment of the fusion peptide sequences (amino acids 512–528) at the N-terminus of the gp41 subunit of BG505, BG505-T/F100FP, and T/F100 trimers. The three amino-acid residues that were swapped in BG505 trimer by the respective residues of T/F100 trimer to generate the BG505-T/F100FP mutant trimer are highlighted in yellow. ELISAs were performed using purified trimers coated on Strep-Tactin plates. Each binding curve was generated using data from three independent experiments. The trimer concentration was kept constant at 1 µg/ml and the bNAb concentration was varied as shown. Results shown are representative of at least three independent experiments performed in triplicates. The P value as determined by the unpaired two-tailed t test is 0.0006 for VRC01 at 0.1 μg/ml of antibody, < 0.0001 for PGT121, PG9 and PGT151, 0.0036 for PG16, and 0.0003 for VRC34.01 at 1 μg/ml of antibody. Error bars denote the standard deviation

