
Figure 3.
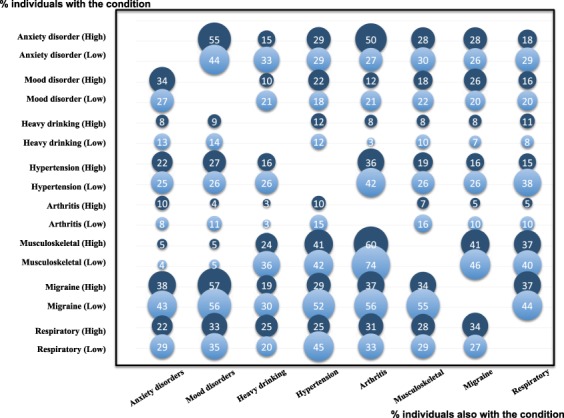
Conditional pairwise proportion of selected multimorbidities among people with common and frequent morbidities from the most affluent (dark blue) and the most deprived (light blue) socioeconomic quartiles.
Official websites use .gov
A
.gov website belongs to an official
government organization in the United States.
Secure .gov websites use HTTPS
A lock (
) or https:// means you've safely
connected to the .gov website. Share sensitive
information only on official, secure websites.
Conditional pairwise proportion of selected multimorbidities among people with common and frequent morbidities from the most affluent (dark blue) and the most deprived (light blue) socioeconomic quartiles.