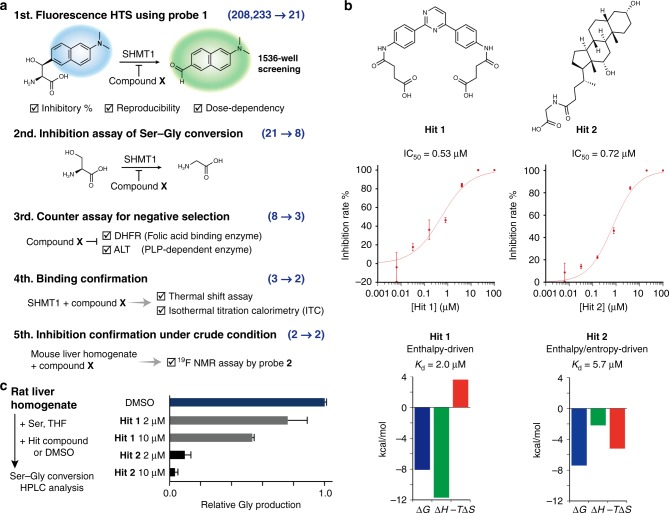
Fig. 6.
hSHMT inhibitor screening by utilizing probe 1. a Schematic illustration for hSHMT1 inhibitor screening. Details are described in the Supplementary Methods for high-throughput screening. b Chemical structures and inhibition properties of hit compounds. The IC50 values for Hits 1 and 2 against hSHMT1 were determined by HPLC analysis of Ser–Gly conversion in the presence of various concentrations of Hits 1 and 2. Error bars represent s.d., n = 3. Thermodynamic parameters of the interactions between hSHMT1 and Hit 1 or Hit 2 were determined by ITC. c Inhibition of Ser–Gly conversion catalyzed by endogenous SHMT by Hits 1 and 2 in rat liver homogenate (250 µg proteins/mL). Ser–Gly conversion by SHMT1 or SHMT2 in the presence of varying concentrations of Hits 1 and 2 was quantified by HPLC analysis. Error bars represent s.d., n = 3. Source data of Fig. 6b, c are provided as a Source Data file

