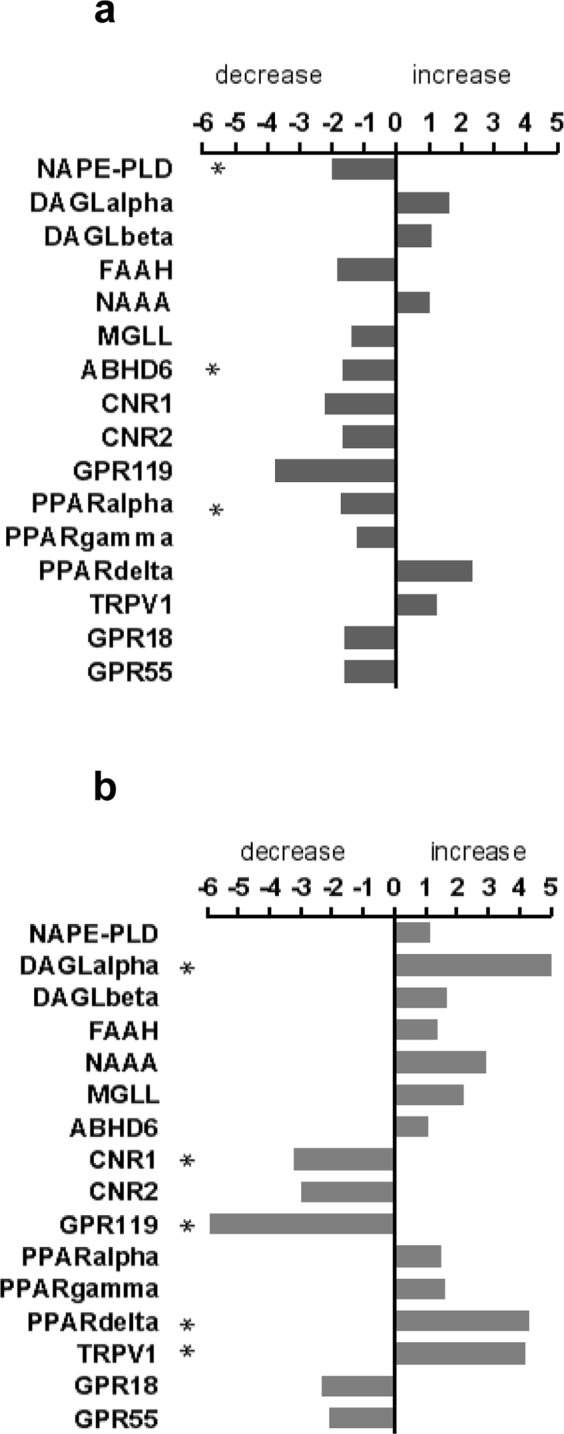
Figure 3.

NanoString analysis of enzyme and receptor transcripts in intestinal mucosal biopsies. Graphs showing fold changes (decrease/increase) of mRNA of enzymes and receptors of the ECS and the endocannabinoidome in intestinal mucosal biopsies of patients with ulcerative colitis (UC) (a) and Crohn’s disease (CD) (b) in comparison to biopsies from control subjects. n = 9–11; One-Way ANOVA was performed between sample groups. Genes with p values < 0.05 and fold changes of at least 1.5 were considered to be significantly regulated (marked by asterisks *). See p values of each target in Supplementary Table S1.
