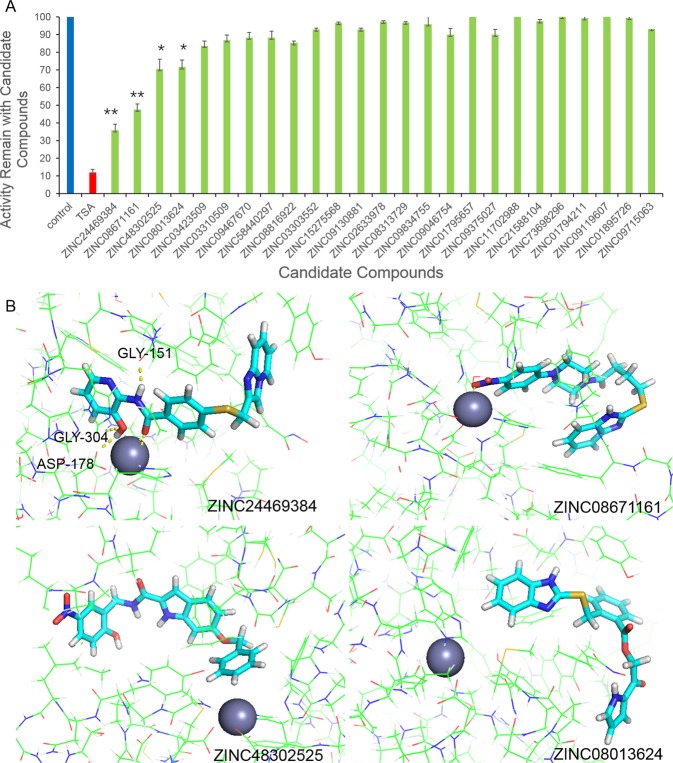
Figure 1.
Inhibitory effect of the 25 hit lead candidates on HDAC and molecular docking results of the four active lead candidates. (A) The HDAC activities ratio of the hit lead candidates. The positive control was represent by blue, the inhibitor control was represent by red, the hit compounds was represent by green. The results are the mean ± S.D. of at least three independent experiments. Two-tailed student’s t-test was performed between HDACi vs. control, *P < 0.05, **P < 0.01. (B) Docking analysis of ZINC24469384, ZINC08671161, ZINC48302525 and ZINC080113624 to HDAC and a yellow dotted line shows the hydrogen bond.

