Figure 5.
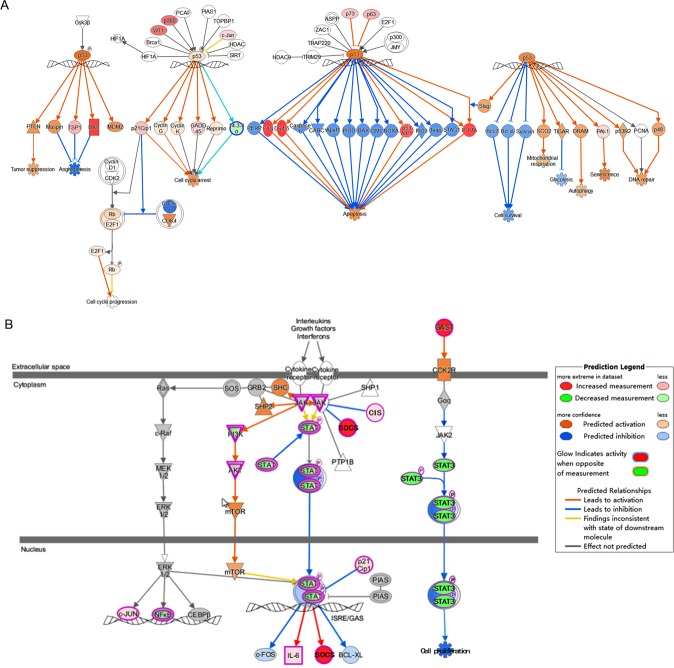
ZINC24469384 regulates genes involved in P53 and STAT signaling pathways. (A) The molecular activate prediction of P53 pathway using genes altered by three time points. (B) The molecular activate prediction of STAT signaling pathways using genes altered by three time points. Different shapes represent different classes of protein, upregulation was represented by red, downregulation was represented by green, direct interaction was represented by solid lines and indirect interactions was represented by dashed lines. The pathways were generated via IPA (QIAGEN Inc., https://www.qiagenbioinformatics.com/products/ingenuity-pathway-analysis/)51.

