Fig. 3.
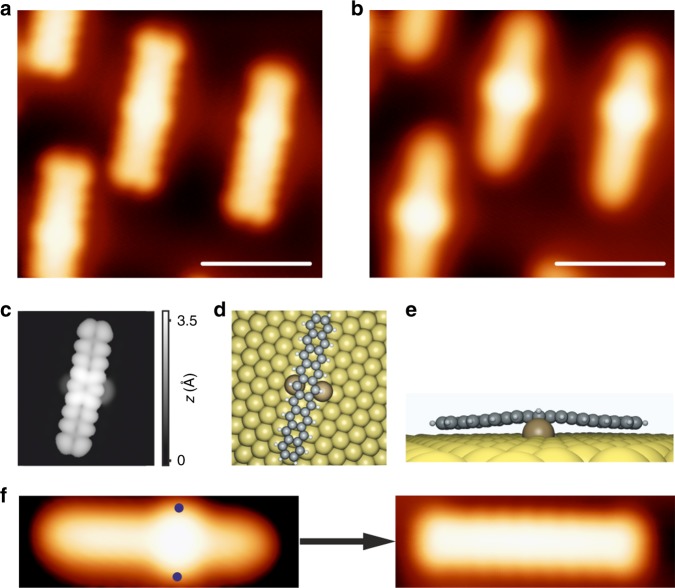
Au-nonacene interactions. a, b High-resolution STM images showing the Au-nonacene interaction as two protrusions at certain Vbias. These interactions are mostly observed around the central benzene ring, though they can also be detected around neighboring benzene rings. a Vb = −1.2 V, I = 15 pA. Scale bar: 2 nm. b Vb = 2.3 V, I = 4 pA. Scale bar: 2 nm. c DFT simulated STM image of an individual nonacene molecule bound to two Au adatoms. Vb = −1.5 V. d, e Top and side views of the corresponding DFT equilibrium geometry. f High-resolution STM images demonstrating the removal of the Au adatoms. Left STM image Vb = 2.0 V, I = 65 pA. Right STM image Vb = −1.0 V, I = 50 pA

