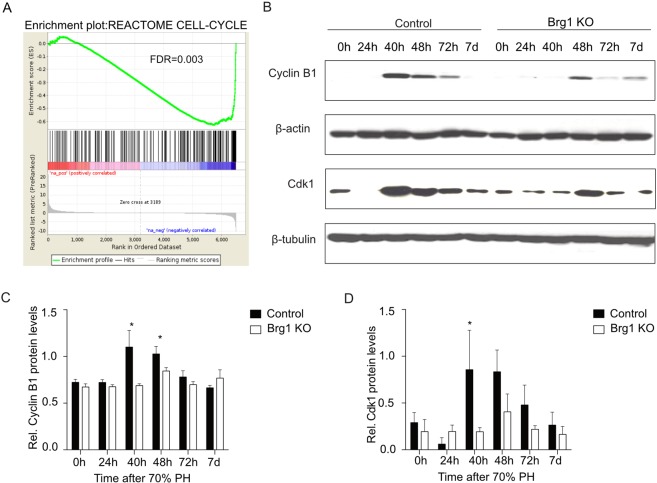
Figure 6.
Impaired cell cycle progression in mice with defective Brg1. (A) GSEA enrichment plot for the cell cycle pathway. GSEA analysis was conducted for detecting differences between the Brg1 KO and the Control group at 48 h post PH. The cell cycle pathway is significantly associated with the Brg1 KO genotype (FDR = 0.0003). (B–D) Protein expression of Cyclin B1 and Cdk1 in the liver after PH was analysed by Western blot. Representative gels (B) and densitometric analyses (C,D) are depicted, n > 3.

