Figure 2.

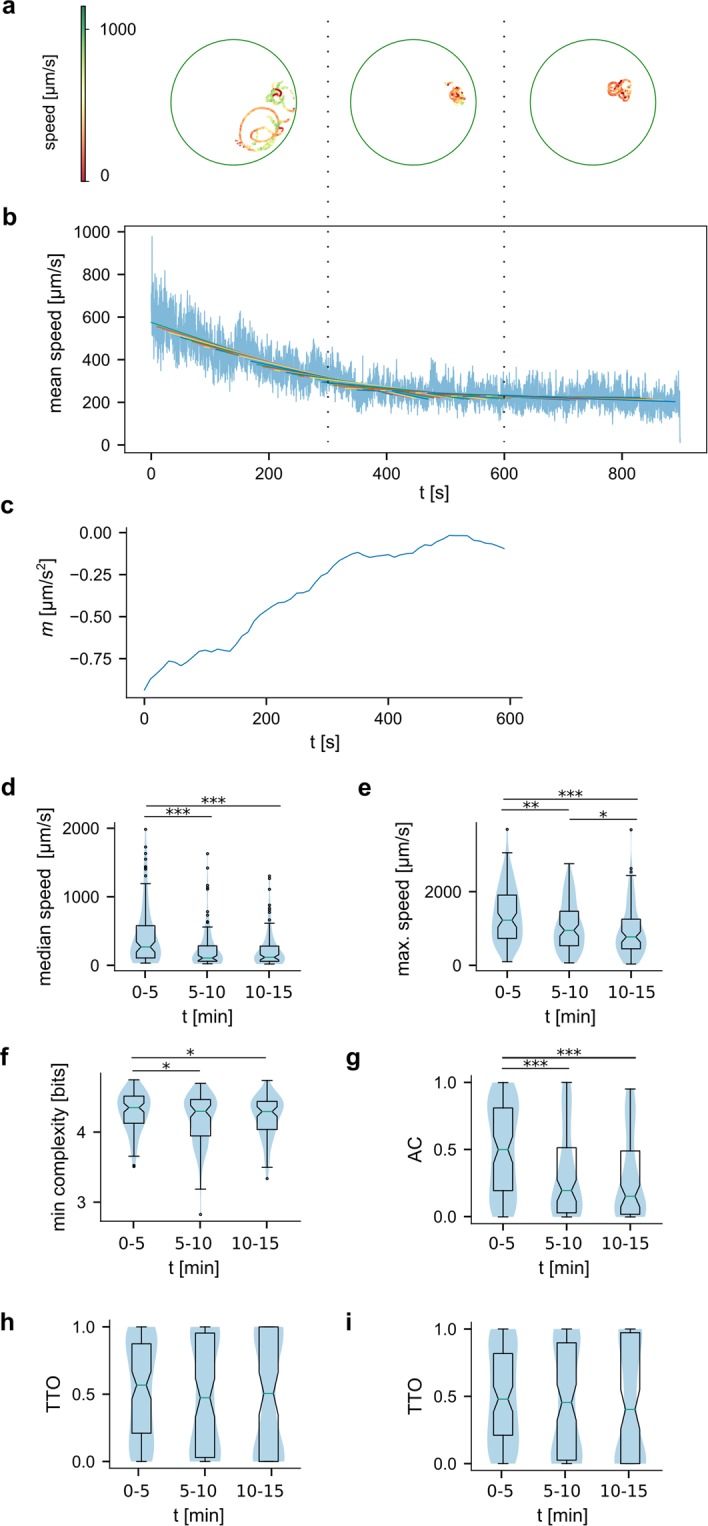
Acclimatization of animals to the arena. Analysis of acclimatization behaviour of larvae in the first 15 minutes after introduction to the arena. (a) An example trajectory of a path during the acclimatization period. The path is plotted in thirds, each corresponding to 5 minutes of the recording as illustrated by the dotted lines linking this and the next panel. (b) Average speed of 105 animals during the 15 minutes after introduction to the arena shows higher speeds immediately after the animals were exposed to the new environment. (c) Slope of linear regression fitted to the average speed (window 5 min, step size 10 s) shows the stabilisation of speed after ca 6 min. We compared (d) median speed, (e) maximum speed, (f) minimal reached path complexity, (g) activity coefficient, (h) TTO and (i) TDO between the first, second and last third of the 15 min acclimatization period (N1 = 105, N2 = 102, N3 = 92).
