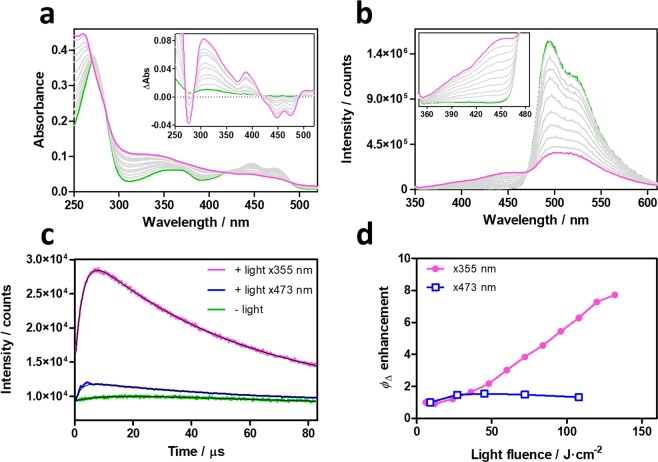
Figure 4.
Spectroscopic characterization of photoconverted miniSOG. Evolution of miniSOG’s absorbance (a) and fluorescence (b) upon laser irradiation at 355 nm. Insets show the difference absorption spectra before and after irradiation, and a zoomed-in image of the new fluorescence bands. (c) Time-resolved NIR 1O2 phosphorescence decays of native (green) and photoconverted miniSOG excited at 473 nm (blue) or 355 nm (magenta). (d) Observed ΦΔ enhancement at 473 nm (blue) and 355 nm (magenta).

