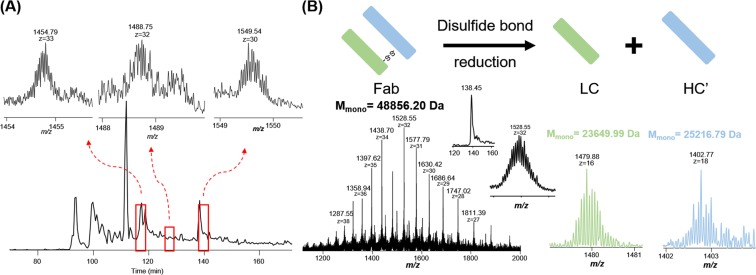
Figure 3.
Light chain and heavy chain pair analysis using reduced and non-reduced Fab fragments. (A) The base peak chromatogram of non-reduced Fab mixture with selected MS spectra of three intact Fabs; (B) An example of a light chain and heavy chain pair. High resolution mass spectra of intact Fab and its corresponding light chain and heavy chain were shown above with detected accurate masses. Mmono represents the monoisotopic mass.

