Fig. 1.
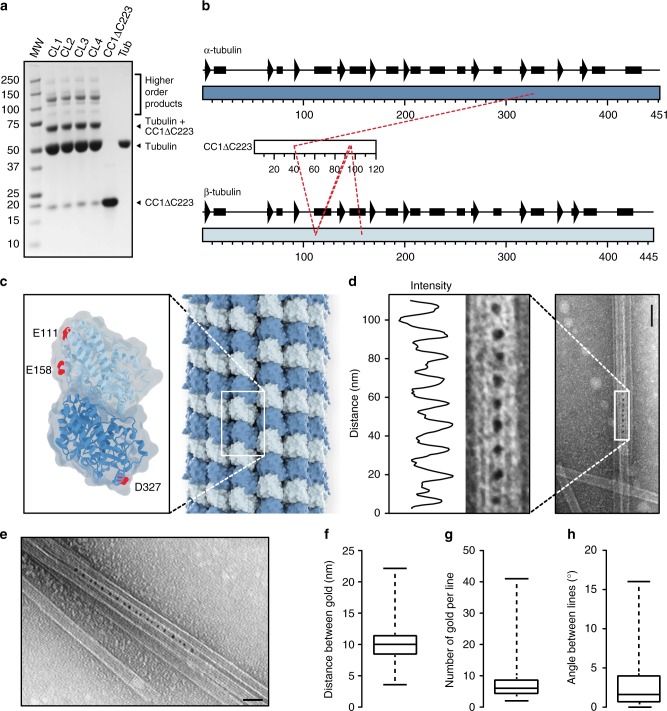
The N-terminus of CC1 binds sites on both α- and β-Tubulin and cross-links microtubules. a SDS-Page of EDC-induced cross-linking of 6xHis-CC1ΔC223 (16 kDa) and tubulin dimers (2 × 55 kDa). Arrowheads depict position of relevant protein bands. MW molecular weight marker, CL1-4 cross-linking reaction 1–4. Higher order cross-linking products represent cross-links between e.g. tubulin +2 × CC1ΔC223 (87 kDa), tubulin dimers (110 kDa), tubulin dimers + CC1ΔC223 (126 kDa), tubulin dimers +2 × CC1ΔC223 (142 kDa). b Schematic views of the secondary structures of α- and β-tubulin, and the CC1ΔC223 sequence. Dashed lines depict detected cross-linking positions of CC1ΔC223 and α- or β-tubulin. c Projection of detected cross-links onto an α/β-tubulin dimer (PDB code 1tub). Dark blue = α-tubulin; Light blue = β-tubulin; Sites for cross-linked amino acids are marked in red. d Representative TEM image of CC1∆C223 distribution along negatively stained, taxol-stabilized microtubules polymerized in the presence of 6xHis-CC1∆C223. CC1∆C223 protein is visualized by a 5 nm gold-conjugated Ni-NTA tag that recognizes 6xHis-tagged proteins. A transect was taken along rows of gold particles, and dips in the light intensity along the transect correspond to gold particle centers. Note the even distribution of the electron-dense gold particles in between neighboring microtubules. Scale bar = 50 nm. e CC1∆C223 distribution along negatively stained, taxol-stabilized microtubules polymerized in the presence of 6xHis-CC1∆C223. CC1∆C223 can form a zipper-like pattern that links microtubules. Scale bar = 100 nm. f Quantification of the distance between individual gold particles as shown in d and e (box plot: Center lines show the medians; box limits indicate the 25th and 75th percentiles; whiskers extend to the minimum and maximum). g, h Quantification of number of gold labels per row (g) and the angle between adjacent gold-labeled rows (h) from images as those in d and e (box plots: Center lines show the medians; box limits indicate the 25th and 75th percentiles; whiskers extend to the minimum and maximum)

