Fig. 2.
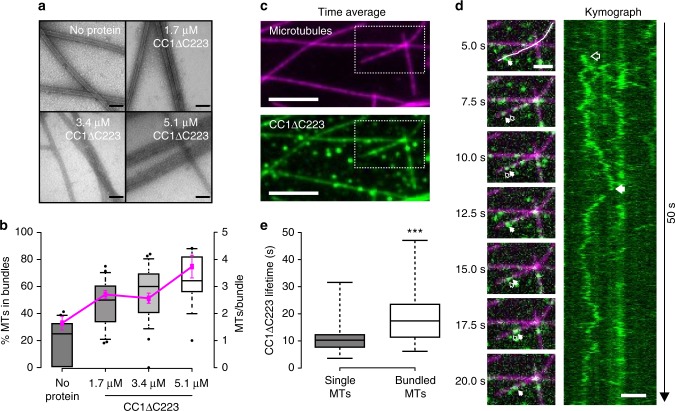
The N-terminus of CC1 induces microtubule bundling and can diffuse along the microtubule lattice. a Transmission electron microscopy (TEM) of negatively stained taxol-stabilized microtubules after addition of increasing levels of 6xHis-CC1∆C223 during microtubule polymerization. Note that it is very difficult to discern individual microtubules in the microtubule bundles after addition of ~3 µM of CC1∆C223. Scale bars = 100 nm. b Quantification of the proportion of microtubules in bundles (left y-axis, box plots: Center lines show the medians; box limits indicate the 25th and 75th percentiles; whiskers extend to the 10th and 90th percentiles, outliers are represented by dots) and number of microtubules/bundle (right y-axis, magenta line: mean ± SEM) with increasing concentration of 6xHis-CC1∆C223 (quantified from images such as those in a). c CF488A-labeled 6xHis-CC1∆C223 proteins (green) associated with surface-bound microtubules (magenta) in vitro. Scale bar = 5 µm. d Time-series images (left panel) of CF488-labeled 6xHis-CC1∆C223 (green) diffusing along microtubules (magenta). Filled arrow = position in current frame, empty arrow = position in previous frame. Scale bar = 2 µm. Representative kymograph (right panel) along solid line in left panel (top) showing diffusion of 6xHis-CC1∆C223 foci. Scale bar = 2 µm. e 6xHis-CC1∆C223 lifetime on single versus bundled microtubules (box plots: Center lines show the medians; box limits indicate the 25th and 75th percentiles; whiskers extend to the minimum and maximum), n = 60 single and 37 bundled microtubules, ***p-value < 0.001, Welch’s unpaired t-test)

