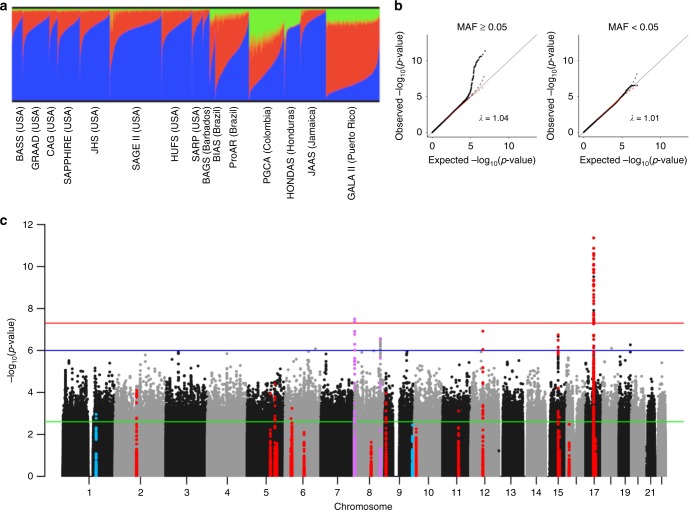
Fig. 1.
Summary of CAAPA ancestry and meta-analysis results. a CAAPA ADMIXTURE estimates: this panel summarizes the genome-wide proportions of ancestry for K = 3 populations, as estimated by the software program ADMIXTURE. A combined dataset of 20,482 overlapping and linkage disequilibrium pruned SNPs in 84 African (YRI, blue) and 84 European (CEU, red) 1000 Genomes Project phase 3 subjects, 43 Native American (green) subjects and 12,223 putatively unrelated CAAPA subjects were used to estimate these ancestry proportions. b QQ plot of the meta-analysis p-values: the plots in this panel are stratified by minor allele frequency (MAF) for low frequency and common SNPs. Inflation factors were calculated by transforming MR-MEGA association p-values to 1 degree of freedom (df) Chi-square statistics, and dividing the median of these statistics by the median of the theoretical Chi-square (1 df) distribution. The dashed black and red lines represent the upper and lower 95% confidence interval. c Manhattan plot of the meta-analysis p-values: the red, blue, and green horizontal lines in the Manhattan plot represent significant (MR-MEGA association p < 5 × 10⁻⁸), suggestive (MR-MEGA association p < 10−6), and candidate gene (MR-MEGA association p < 2.6 × 10⁻³) value thresholds, respectively. The candidate gene threshold is a Bonferroni-adjusted alpha level for 20 tests (1 locus from EVE, 1 locus from eMERGE, and 18 loci from TAGC). Windows of ±10 KB around the lead SNP at each selected locus are colored blue (EVE and eMERGE loci), red (TAGC loci), and purple (CAAPA loci with lead SNPs having p < 10−6). A larger window of ±200 KB is shown for the chromosome 17q12–21 locus

