Fig. 2.
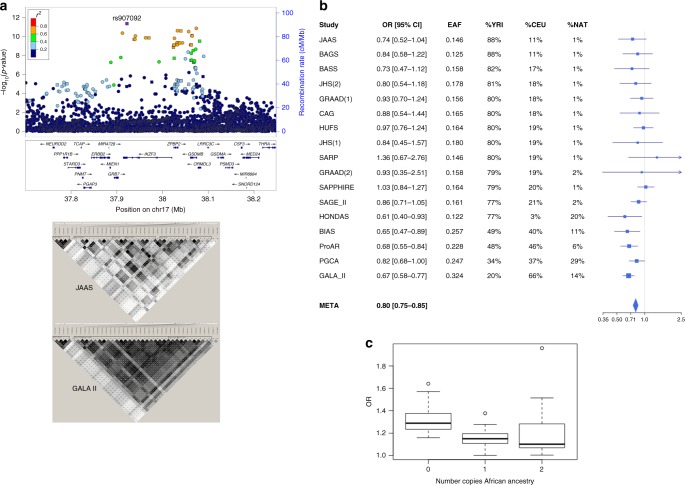
Summary of the chromosome 17q12–21 region results. a This panel shows a locus zoom plot of the CAAPA meta-analysis results. Positions of 39 SNPs associated with asthma in TAGC Europeans that replicated in CAAPA (from Supplementary Table 13) are denoted by squares. The r2 between the lead SNP rs907092 and the other SNPs with associations (represented by red, orange, green, light, and dark blue symbols) was calculated using African American subjects from the CAAPA WGS reference panel. The r2 between the 39 SNPs in JAAS and GALA II are shown at the bottom of the plot, with darker shades of grey representing higher LD. JAAS and GALA II are the studies with the highest and lowest proportions of African ancestry, respectively. b A Forest plot of the effect size of rs907092 is shown in this panel. CAAPA datasets are ordered by decreasing percentage African ancestry. EAF effect allele frequency. %YRI, CEU, and NAT represent estimated mean percentage of African, European, and Native American ancestry, respectively. c This panel shows a box plot of the asthma risk allele odds ratio for 22 candidate SNPs in the chromosome 17q12–21 region. The 17 SNPs discussed by Stein et al.13 were selected, and an additional five SNPs from the CAAPA meta-analysis, with MR-MEGA association p < 10−6 and r2 < 0.8 with all 17 selected SNPs in the 1000 Genomes Project European and African populations, were also included. These five additional SNPs are also expression quantitative trait loci for GSDMB/GSDMA/ORDLM3 in one or more GTEx tissues. The center line represents the median odds ratio, the box bounds represent the first and third quartile of the odds ratio distribution, and the whiskers are 1.5 times the first and third quartile odds ratio. Outliers are represented by circles

