Fig. 3.
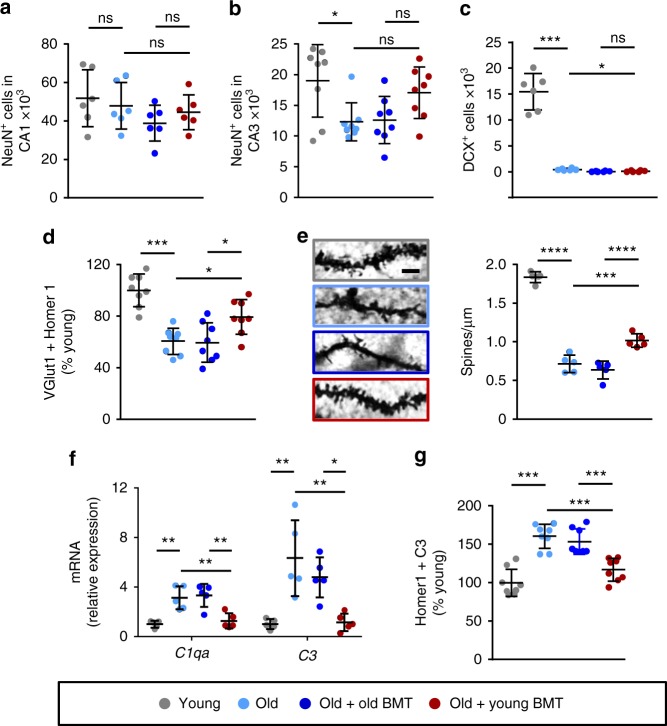
Synapses were preserved in young bone marrow recipients. Neurons and synapses in the hippocampus were evaluated 6 months post-transplantation. a, b Neuron numbers in the CA1 (a) and CA3 (b) regions were assessed by NeuN staining. n = 6–8 mice per group, pooled from 2 independent experiments. c Newly-born neurons were assessed by counting doublecortin (DCX)+ cells. n = 6 mice per group. d Synapses were counted by evaluating co-localization of VGlut1 (pre-synaptic) and Homer1 (post-synaptic). n = 8 mice per group, pooled from 2 independent experiments. e Spine density was visualized and quantified on Golgi-impregnated slices. Scale bar: 2.5 μm. n = 5 mice per group. f Complement expression was assessed by RT-PCR (normalized to Gapdh mRNA). n = 5 mice per group, pooled from 2 independent experiments. g C3 deposition on synapses was evaluated by assessing C3 co-localization with Homer1. n = 8 mice per group, pooled from 2 independent experiments. The dotplots show mean plus standard deviation. *p < 0.05, **p < 0.01, ***p < 0.001, ****p < 0.0001 (ANOVA with Tukey-Kramer post-hoc test)

