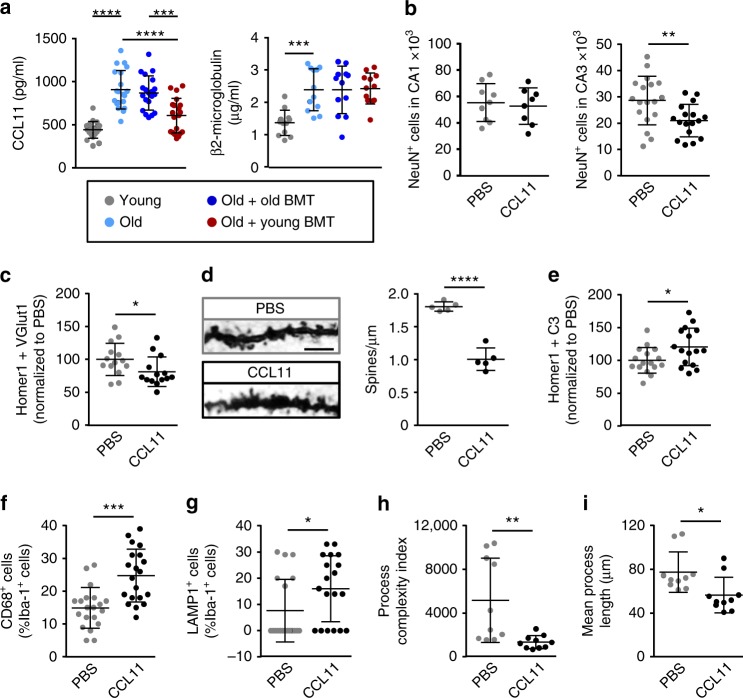
Fig. 5.
Circulating CCL11 levels were reduced in young bone marrow recipients and CCL11 injection into young mice mimicked hippocampal aging. a CCL11 and β2-microglobulin levels in the plasma of control mice and BMT recipients were quantified by ELISA. n = 12–20 mice per group, pooled from 2 independent experiments. b–i CCL11 was administered by intraperitoneal injection into young (4-month) mice (4 injections over 10 days), prior to histological and molecular analyses of the hippocampus. b Neuron numbers in the CA1 and CA3 regions were assessed by NeuN staining. n = 8–18 mice per group, pooled from 2 independent experiments. c Synapses were evaluated by co-localization of VGlut1 (pre-synaptic) and Homer1 (post-synaptic) markers. n = 14 mice per group, pooled from 2 independent experiments. d Spine density was assessed and quantified by Golgi impregnation of CA3 neurons. Scale bar: 2.5 μm. n = 5 mice per group. e C3 deposition on synapses was evaluated by C3 co-localization with Homer1. n = 16 mice per group, pooled from 2 independent experiments. f–i Microglial activation was assessed by measuring the percentage of Iba1+ cells with cytosolic co-staining of CD68 (f) or LAMP1 (g), as well as the complexity (h) and length (i) of microglial processes. n = 19–20 mice per group (CD68 and LAMP1 counts) or 10 mice per group (microglial morphology), pooled from 2 independent experiments. The dotplots show mean plus standard deviation. *p < 0.05, **p < 0.01, ***p < 0.001, ****p < 0.0001 (a—ANOVA with Tukey-Kramer post-hoc test; b–i—Student’s t-test)

