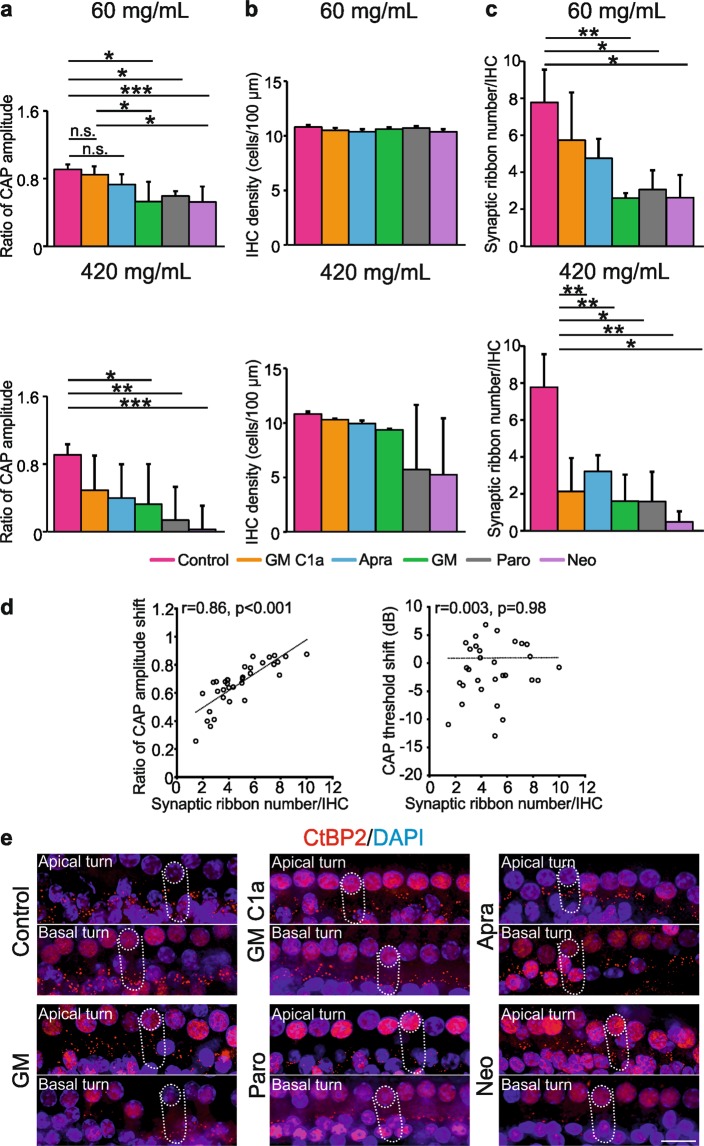
Figure 4.
AG-induced cochleotoxicity on CAP amplitude and survival of IHC elements. (a) Comparison of ratios of CAP amplitudes (day 21/ before application) for the ‘basal region’ (60, 420 mg/mL). (b) Quantitative analysis of surviving IHCs, on day 21. (c) Survival of synaptic ribbons, on day 21, following administration of 60 or 420 mg/mL AGs. Data are means ± SD. *p < 0.05; **p < 0.01; ***p < 0.001 (one-way ANOVA with Tukey’s multiple comparison tests). (a) 60 mg/mL p < 0.0001, 420 mg/mL p = 0.0009; (b) 60 mg/mL p = 0.0764, 420 mg/mL p = 0.1194; (c) 60 mg/mL p = 0.0051, 420 mg/mL p = 0.0011). Correlations between the ratio of CAP amplitude (day 21/before application)/CAP threshold shifts and synaptic ribbon number in animals receiving 60 mg/mL AGs (n = 34) (d). Representative immunohistochemistry images showing synaptic ribbon loss in the IHCs after applying either control solution or AGs. (e) Scale bar, 20 µm. Abbreviations: AG, aminoglycoside; Apra, apramycin; CAP, compound action potential; CtBP2, C-terminal-binding protein 2; GM, gentamicin; GM C1a, gentamicin C1a; Neo, neomycin; Paro, paromomycin.

