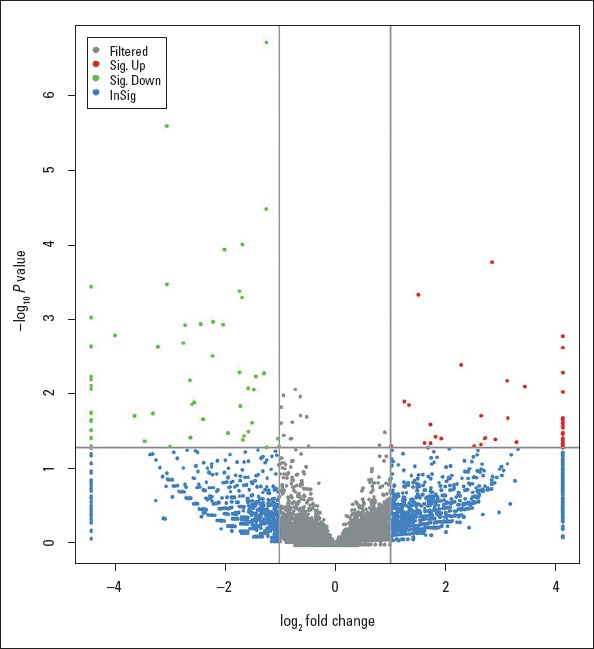
Figure 1.

Volcano plot of circRNAs between AF and controls. Green plots represent down-regulated circRNAs. Red plots represent up-regulated circRNAs with absolute |log2 Fold Change| >1.0 and corrected P-value <0.05. Gray plots represent circRNAs with no significant difference. Blue plots represent circRNAs with |log2 Fold Change| >1.0 but with no significant difference
