Figure 2.

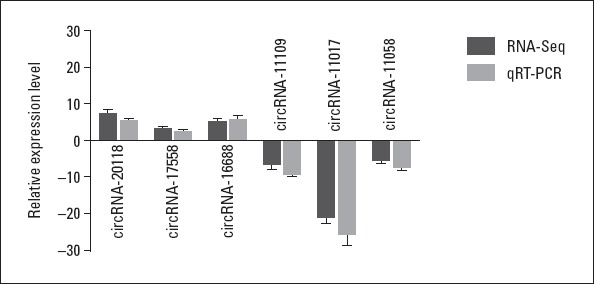
Comparison of circRNA expression levels between sequencing and qRT-PCR results. The Y-axis of the columns in the chart represents the log2-transformed fold changes computed from the sequencing and qRT-PCR data

Comparison of circRNA expression levels between sequencing and qRT-PCR results. The Y-axis of the columns in the chart represents the log2-transformed fold changes computed from the sequencing and qRT-PCR data