
Figure 5.
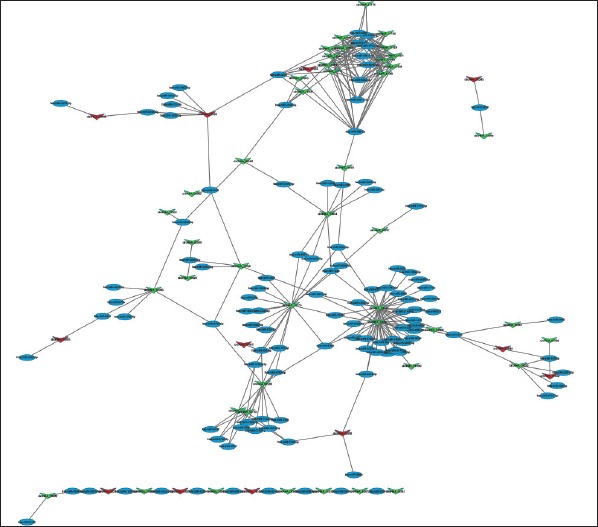
circRNA–miRNA regulatory network analysis of ncRNAs in patients with AF. Red diamonds represent up-regulated circRNAs. Green diamonds represent down-regulated circRNAs. Blue dots represent miRNA
Official websites use .gov
A
.gov website belongs to an official
government organization in the United States.
Secure .gov websites use HTTPS
A lock (
) or https:// means you've safely
connected to the .gov website. Share sensitive
information only on official, secure websites.
circRNA–miRNA regulatory network analysis of ncRNAs in patients with AF. Red diamonds represent up-regulated circRNAs. Green diamonds represent down-regulated circRNAs. Blue dots represent miRNA