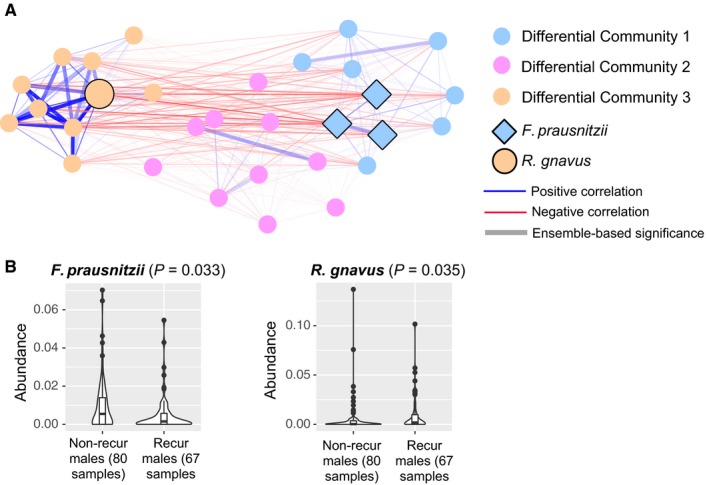
Figure 5.

A, Differential network communities. The edges represent significant SparCC correlations after UDCA treatment, with red indicating negative correlation and blue indicating positive correlation. Opacity of edges is proportional to the absolute value of SparCC correlation coefficients. Thicker edges denote statistical significance of P < 0.001 by all three methods (Spearman, Pearson and SparCC; ie, edges that are significant by our ensemble method). Nodes represent the top thirty ASVs in the differential network communities, with the node color indicating community membership. Nodes with black borders are annotated to Faecalibacterium prausnitzii or Ruminococcus gnavus. B, Violin plots showing the abundance distribution of two ASVs annotated to F prausnitzii and R gnavus in males with or without recurrence after UDCA treatment. P‐values computed using Wilcoxon rank‐sum test.
