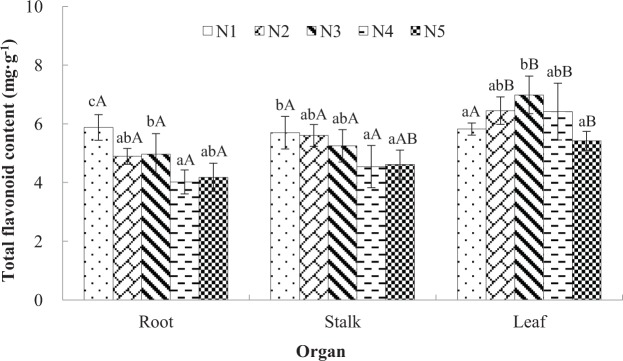
Figure 4.
Effects of nitrogen treatments on the total flavonoid contents of different organs in Cyclocarya paliurus seedlings. Values within each graph followed by the different letters indicate significant differences among nitrogen treatments (lower case) and organs (upper case) (n = 3) according to Duncan’s test (p < 0.05). N1, N2, N3, N4 and N5 represent the concentrations of NH4NO3 were 0, 0.19, 0.63, 1.13 and 2.00 mM, respectively.

