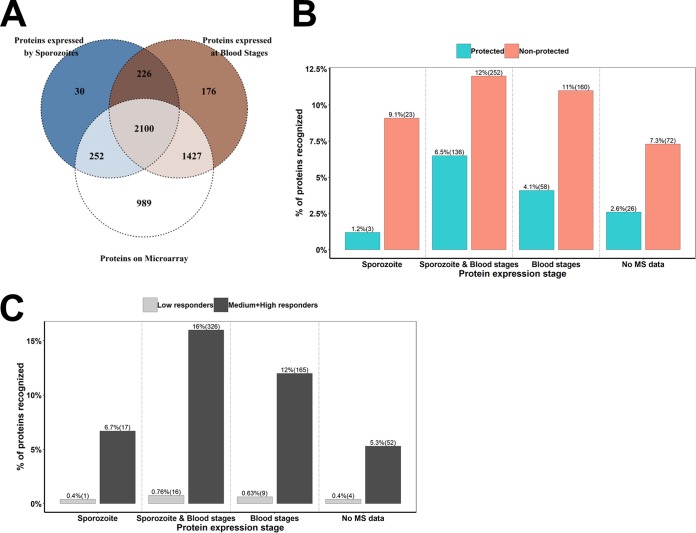
FIG 3.
Stage of expression of proteins printed on the microarray. Publicly available tandem mass spectrometry (MS/MS) data on protein expression were obtained from PlasmoDB. (A) Venn diagram showing stage-specific profiles of the proportions of proteins expressed by sporozoite and blood stages with MS/MS evidence of expression and printed on the microarray. (B and C) Bar plots showing numbers of P. falciparum proteins uniquely or commonly expressed at sporozoite and/or blood stages and recognized by at least 25% of nonprotected or protected volunteers (B) or low, medium, and high responders (C). The names and gene annotations of these proteins are indicated in Table S1 in the supplemental material.

