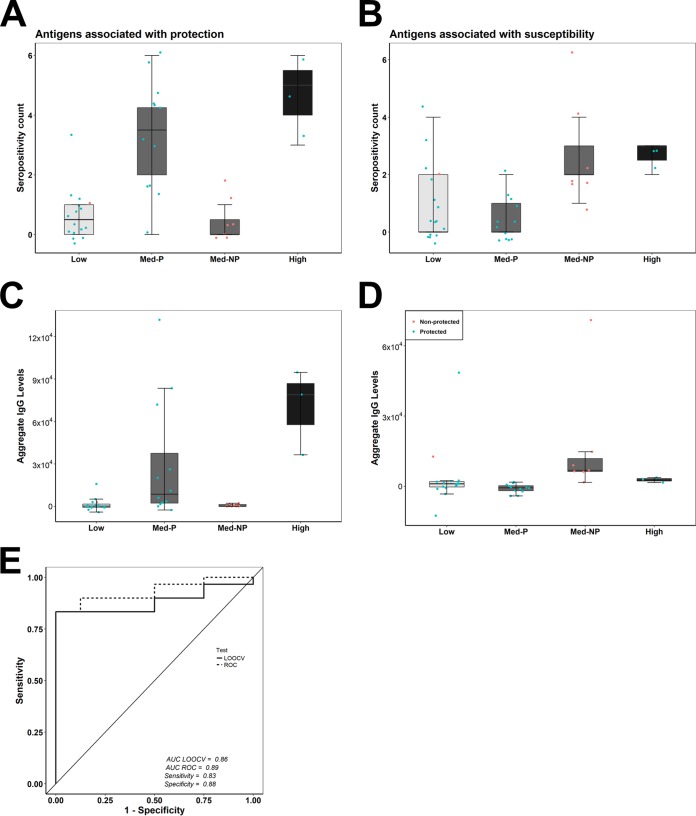
FIG 5.
Breadth of antigen response as a correlate of protection. (A and B) Breadth counts of protective (A) and nonprotective (B) antigens in protected (n = 30) and nonprotected volunteers (n = 8). Dots show individual data points, center lines show the medians, box limits indicate the 25th and 75th percentiles, and whiskers extend 1.5 times the IQR. Antibody intensities were compared using the Wilcoxon rank sum test. (C) The difference between protective and susceptible seropositivity counts was used to construct an ROC curve. LOOCV analysis was also performed. An AUC value of 0.5 indicates that there is no difference between the groups.

