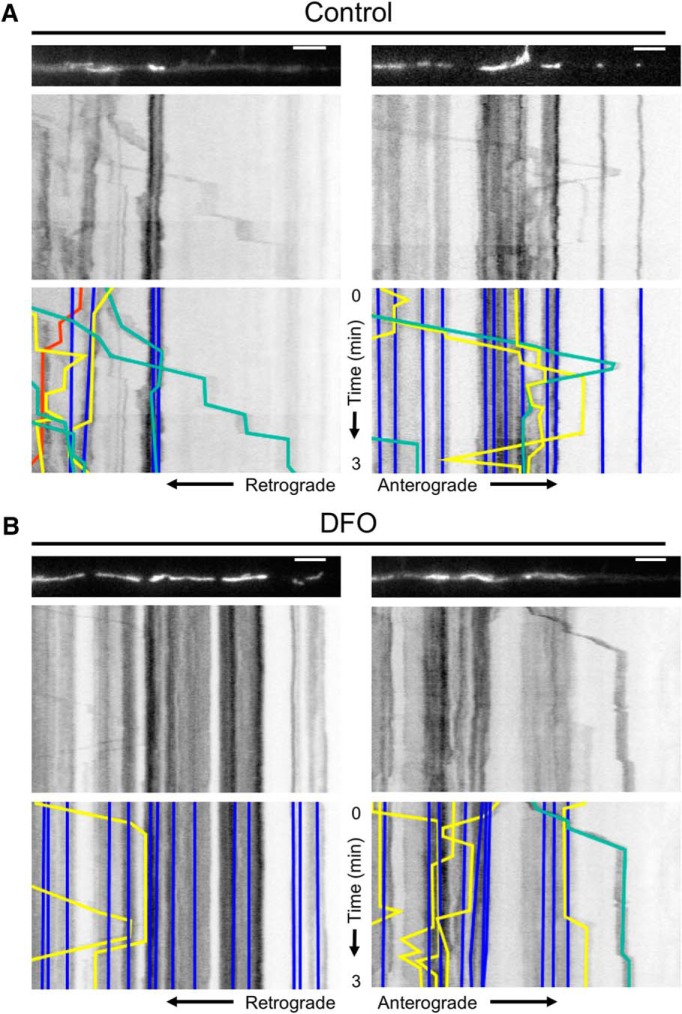
Figure 2.
Dendritic mitochondrial motility analysis with KymoAnalyzer. Hippocampal neurons cultured from E16 mice were treated with DFO and 5-FU beginning at 3 DIV. At 11 DIV, time-lapse live cell imaging of mCherry-Mito-7 transfected neurons was performed for 3 min. Two representative 63× images (t = 0 min) of fluorescently labeled mitochondria within terminal dendrites and the corresponding kymographs are shown for (A) control and (B) DFO neurons. For better visualization, the mitochondria images were straightened using the ImageJ “Straighten” command. Bottom, The resulting manually traced tracks for individual stationary (blue), anterograde (green), retrograde (red), and reversing (yellow) mitochondria. The full 3 min movies for each representative dendrite are shown in Movie 1. Scale bars, 5 μm.

