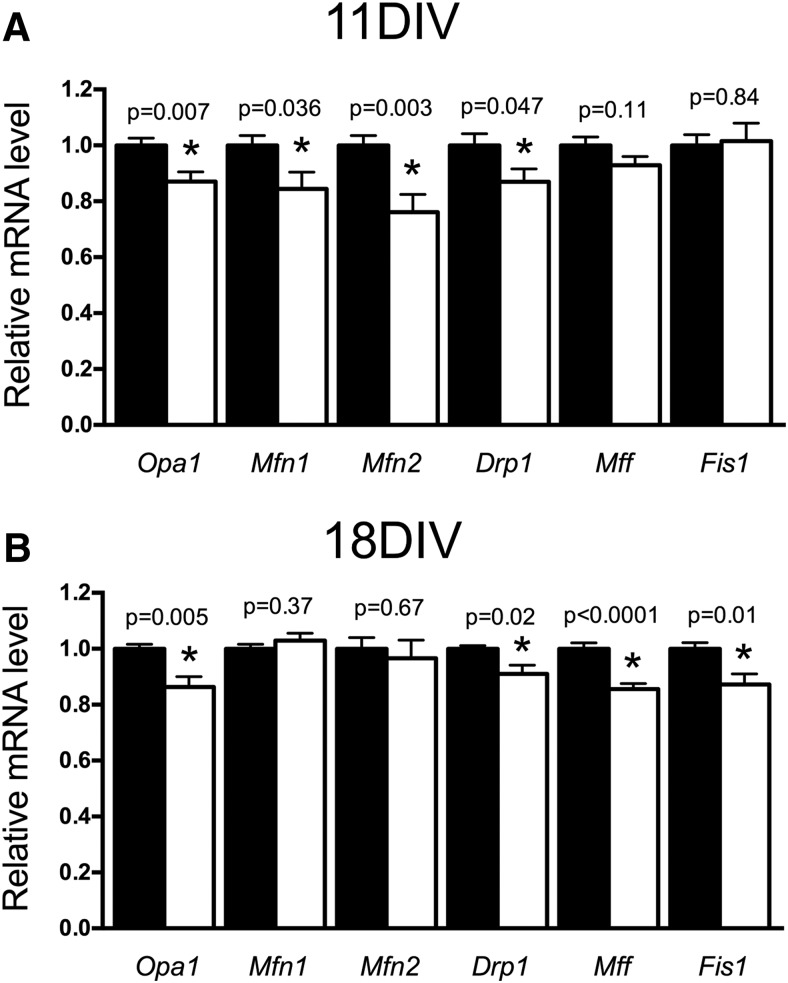
Figure 6.
The effect of DFO treatment on mitochondrial gene expression indexing fusion and fission. Hippocampal neurons cultured from E16 mice were treated with DFO and 5-FU beginning at 3 DIV. At (A) 11 DIV and (B) 18 DIV, cells were collected, total RNA was extracted, and cDNA was synthesized. qRT-PCR was performed for genes indexing fusion (i.e., Opa1, Mfn1, Mfn2) and fission (i.e., Drp1, Mff, and Fis1). Relative mRNA levels are calculated relative to an internal control cDNA sample and a reference gene (i.e., Tbp). The data from two or three independent cultures were pooled and are presented as mean ± SEM. Statistical difference between groups for an individual gene at a given age was determined by unpaired Student's t test with α = 0.05. 11 DIV t values: Opa1 (t(22) = 2.99), Mfn1 (t(22) = 2.24), Mfn2 (t(22) = 3.30), Drp1 (t(22) = 2.11), Mff (t(22) = 1.67), Fis1 (t(22) = 0.21). 18 DIV t values: Opa1 (t(17) = 3.27), Mfn1 (t(17) = 0.93), Mfn2 (t(17) = 0.43), Drp1 (t(11.3) = 2.75, Welch's correction), Mff (t(17) = 5.05), Fis1 (t(17) = 2.83). *Statistical comparison with a p value that meets the threshold for a significant “discovery” after FDR analysis. 11 DIV: n = 12; 18 DIV: n = 9 or 10.

