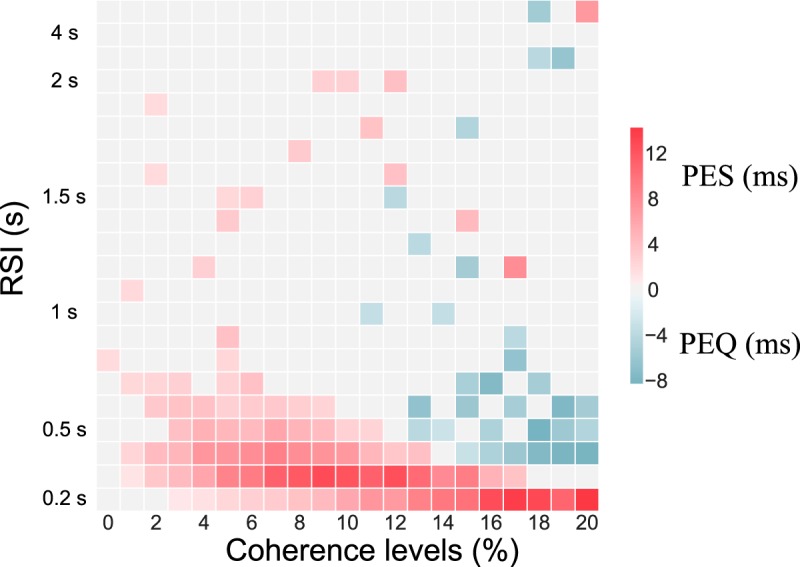
Figure 10.

Post-error slowing depending on RSI. A, Phase diagram of the PES effect at ICD,max = 0.045 nA. The red square corresponds to regions where PES is observed, and the blue ones where PEQ is observed (the darker the color, the stronger the effect). We used a bootstrapped confidence interval to decide whether or not PES/PEQ is observed.
