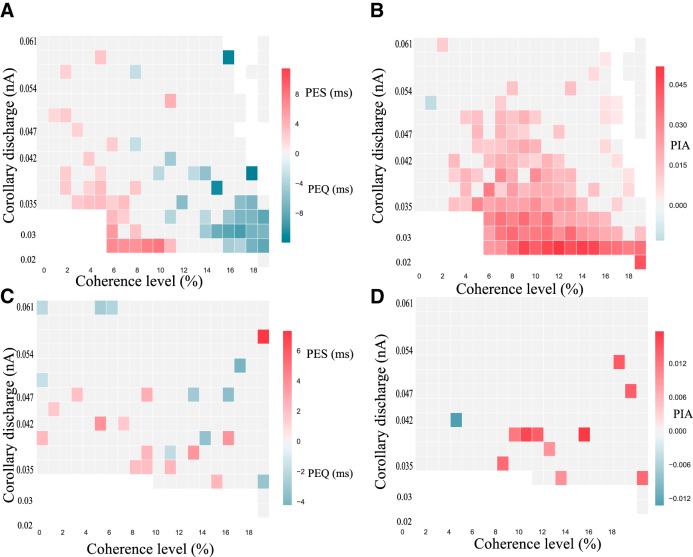
Figure 13.
Post-error adjustments at τCD = 500 ms (A, B), and second-order post-error adjustments (C, D). A, Phase diagram of the PES effect. We used a bootstrapped confidence interval to decide whether or not PES (or PEQ) is observed. B, Phase diagram of the PIA effect. The observation of post-error adjustments is highly impacted with the value of τCD, because we do not observe PES for the same range of parameters. C, Phase diagram of the PES effect at the n + 2 trial. D, Phase diagram of the PIA effect at the n + 2 trial. One sees rare isolated red squares, indicating the absence of any systematic effect. For all panels, simulations with a RSI of 500 ms, other parameters as in Table 1. Color-code as in Figure 9.

