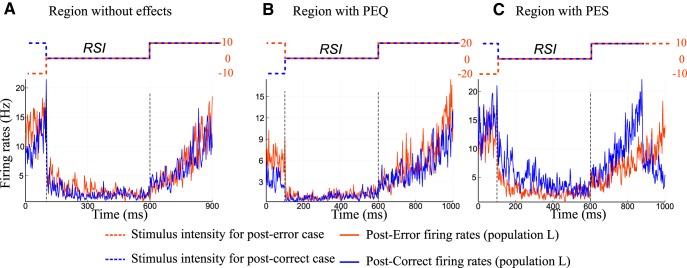
Figure 14.
Neural activities of individual trials. A, Dynamics for individual trials for the winning populations of the next trial: in blue the post-correct case and in red the post-error one. The dashed lines represent the coherence of the stimuli with respect to time. In blue we represent the post-correct case, and in red the post-error one. The parameters are set to a region without PES or PEQ effects (ICD = 0.047 nA and c = ± 10%). B, Dynamics in the region of PEQ (ICD = 0.047 nA and c = ± 20%). On this trial we can notice that the post-error dynamics is faster than the post-correct one. C, The parameters are set to the PES region (ICD = 0.035 nA and c = ± 10%). The post-correct dynamics (in blue) reaches the threshold sooner than the post-error one (in red).

