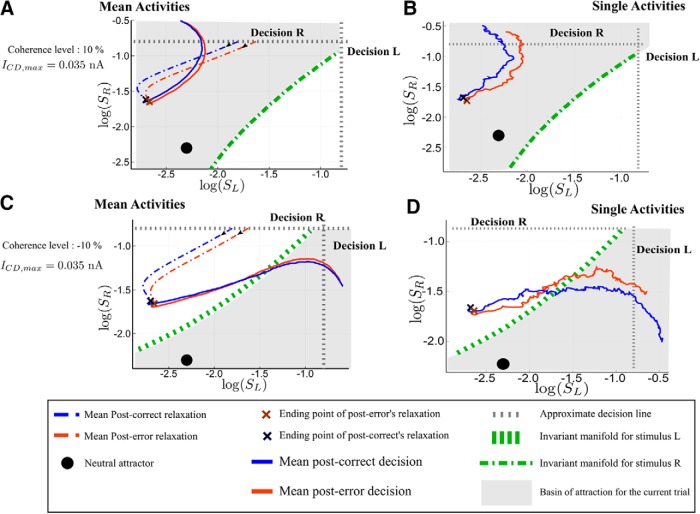
Figure 16.
Analysis of the post-error trajectories for the PES regime. Phase-plane trajectories (in log-log plot, for ease of viewing) of the post-correct and post-error trials. We consider that the previous decision was decision R. The black filled circle shows the neutral attractor state (during the relaxation period). During the presentation of the next stimulus, the attractors and basins of attraction change (gray area and the green dashed lines). A, B, PES and PIA regime (c = 10% and ICD,max = 0.035 nA) in the repeated case. The blue color codes for post-correct trials, and the red one for post-error. A, Average dynamics; B, single trajectories during the next trial. C, D, Regime with PES and PIA in the alternated case (c = −10% and ICD,max = 0.035 nA). The dynamics after the relaxation is followed during 400 ms for repeated and 800 ms for alternated case, as if there were no decision threshold. The actual decision occurs at the crossing of the dashed gray line, indicating the threshold.

