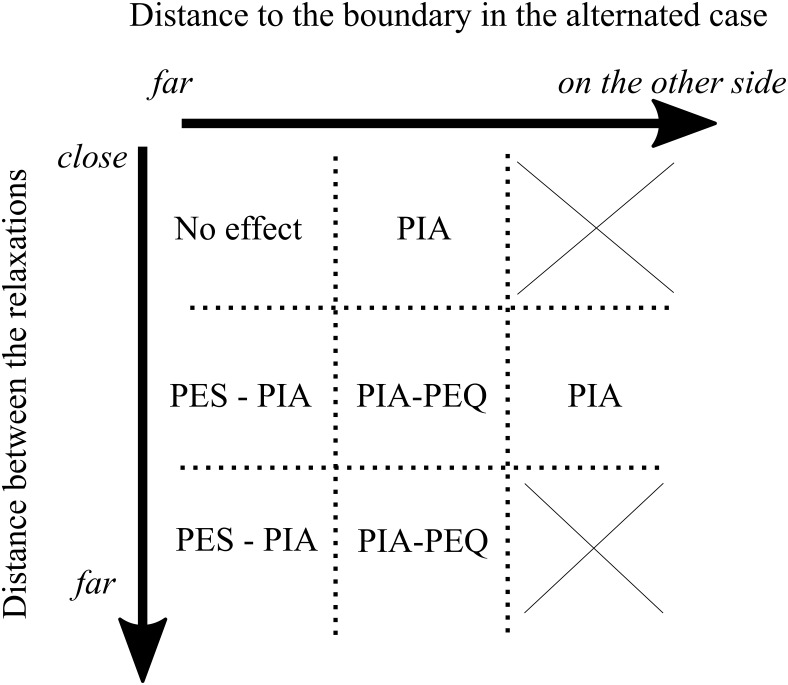
Figure 20.
Schematic diagram of the post-error adjustments observations. The x-axis represents the distance between the ending state of the relaxations and the boundary of the following basins of attraction. It goes from “the ending states are far away from the boundary” to “both ending states are in correct basin of attraction”. The y-axis corresponds to the distance between the post-error and post-correct relaxations. The crosses denote regions that are not relevant, or inside which the network do not commit errors.

